Dutch West Indian vs Bangladeshi 2nd Grade
COMPARE
Dutch West Indian
Bangladeshi
2nd Grade
2nd Grade Comparison
Dutch West Indians
Bangladeshis
97.9%
2ND GRADE
63.8/ 100
METRIC RATING
156th/ 347
METRIC RANK
96.5%
2ND GRADE
0.0/ 100
METRIC RATING
332nd/ 347
METRIC RANK
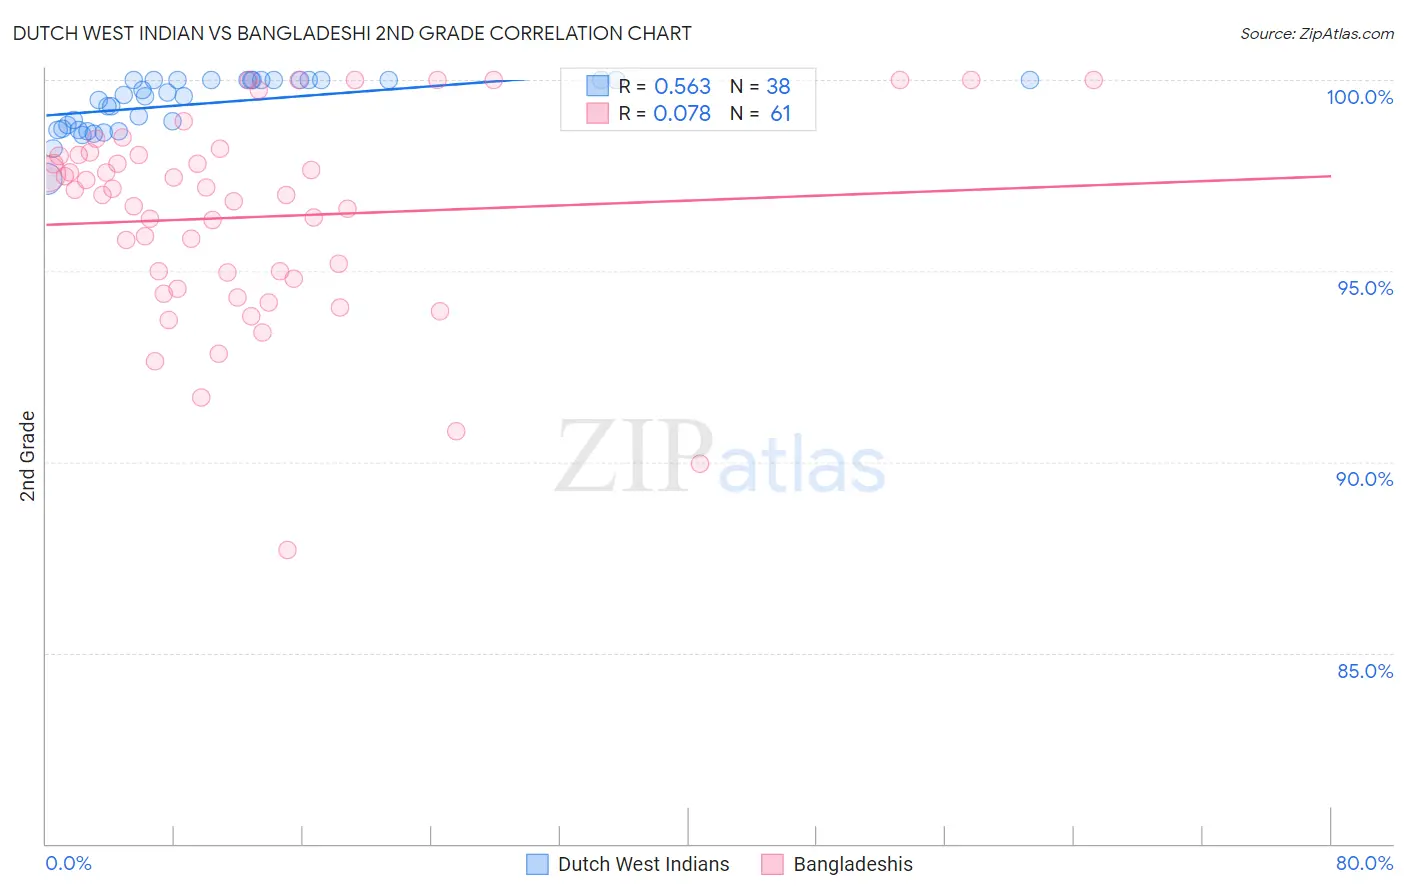
Dutch West Indian vs Bangladeshi 2nd Grade Correlation Chart
The statistical analysis conducted on geographies consisting of 85,776,075 people shows a substantial positive correlation between the proportion of Dutch West Indians and percentage of population with at least 2nd grade education in the United States with a correlation coefficient (R) of 0.563 and weighted average of 97.9%. Similarly, the statistical analysis conducted on geographies consisting of 141,430,495 people shows a slight positive correlation between the proportion of Bangladeshis and percentage of population with at least 2nd grade education in the United States with a correlation coefficient (R) of 0.078 and weighted average of 96.5%, a difference of 1.5%.
2nd Grade Correlation Summary
| Measurement | Dutch West Indian | Bangladeshi |
| Minimum | 97.4% | 87.7% |
| Maximum | 100.0% | 100.0% |
| Range | 2.6% | 12.3% |
| Mean | 99.4% | 96.4% |
| Median | 99.6% | 97.0% |
| Interquartile 25% (IQ1) | 98.7% | 94.7% |
| Interquartile 75% (IQ3) | 100.0% | 98.0% |
| Interquartile Range (IQR) | 1.3% | 3.4% |
| Standard Deviation (Sample) | 0.67% | 2.6% |
| Standard Deviation (Population) | 0.67% | 2.6% |
Similar Demographics by 2nd Grade
Demographics Similar to Dutch West Indians by 2nd Grade
In terms of 2nd grade, the demographic groups most similar to Dutch West Indians are French American Indian (97.9%, a difference of 0.0%), Venezuelan (97.9%, a difference of 0.0%), Immigrants from Iran (97.9%, a difference of 0.0%), Comanche (97.9%, a difference of 0.0%), and Marshallese (97.9%, a difference of 0.010%).
| Demographics | Rating | Rank | 2nd Grade |
| Apache | 74.0 /100 | #149 | Good 97.9% |
| Immigrants | Moldova | 72.9 /100 | #150 | Good 97.9% |
| Soviet Union | 70.7 /100 | #151 | Good 97.9% |
| Immigrants | North Macedonia | 68.5 /100 | #152 | Good 97.9% |
| Immigrants | South Central Asia | 68.3 /100 | #153 | Good 97.9% |
| Marshallese | 67.7 /100 | #154 | Good 97.9% |
| French American Indians | 64.3 /100 | #155 | Good 97.9% |
| Dutch West Indians | 63.8 /100 | #156 | Good 97.9% |
| Venezuelans | 63.3 /100 | #157 | Good 97.9% |
| Immigrants | Iran | 62.8 /100 | #158 | Good 97.9% |
| Comanche | 62.8 /100 | #159 | Good 97.9% |
| Immigrants | Eastern Europe | 61.1 /100 | #160 | Good 97.9% |
| Immigrants | Russia | 60.3 /100 | #161 | Good 97.9% |
| Immigrants | Italy | 60.2 /100 | #162 | Good 97.9% |
| Bermudans | 59.4 /100 | #163 | Average 97.9% |
Demographics Similar to Bangladeshis by 2nd Grade
In terms of 2nd grade, the demographic groups most similar to Bangladeshis are Immigrants from Armenia (96.5%, a difference of 0.010%), Immigrants from Latin America (96.5%, a difference of 0.050%), Immigrants from Vietnam (96.5%, a difference of 0.060%), Mexican (96.5%, a difference of 0.060%), and Japanese (96.5%, a difference of 0.060%).
| Demographics | Rating | Rank | 2nd Grade |
| Dominicans | 0.0 /100 | #325 | Tragic 96.6% |
| Immigrants | Honduras | 0.0 /100 | #326 | Tragic 96.6% |
| Immigrants | Vietnam | 0.0 /100 | #327 | Tragic 96.5% |
| Mexicans | 0.0 /100 | #328 | Tragic 96.5% |
| Japanese | 0.0 /100 | #329 | Tragic 96.5% |
| Immigrants | Latin America | 0.0 /100 | #330 | Tragic 96.5% |
| Immigrants | Armenia | 0.0 /100 | #331 | Tragic 96.5% |
| Bangladeshis | 0.0 /100 | #332 | Tragic 96.5% |
| Immigrants | Dominican Republic | 0.0 /100 | #333 | Tragic 96.4% |
| Central Americans | 0.0 /100 | #334 | Tragic 96.4% |
| Yakama | 0.0 /100 | #335 | Tragic 96.4% |
| Immigrants | Fiji | 0.0 /100 | #336 | Tragic 96.4% |
| Immigrants | Cambodia | 0.0 /100 | #337 | Tragic 96.4% |
| Immigrants | Cabo Verde | 0.0 /100 | #338 | Tragic 96.3% |
| Guatemalans | 0.0 /100 | #339 | Tragic 96.3% |