Dutch West Indian vs Immigrants from Liberia 12th Grade, No Diploma
COMPARE
Dutch West Indian
Immigrants from Liberia
12th Grade, No Diploma
12th Grade, No Diploma Comparison
Dutch West Indians
Immigrants from Liberia
88.5%
12TH GRADE, NO DIPLOMA
0.0/ 100
METRIC RATING
289th/ 347
METRIC RANK
90.4%
12TH GRADE, NO DIPLOMA
5.7/ 100
METRIC RATING
221st/ 347
METRIC RANK
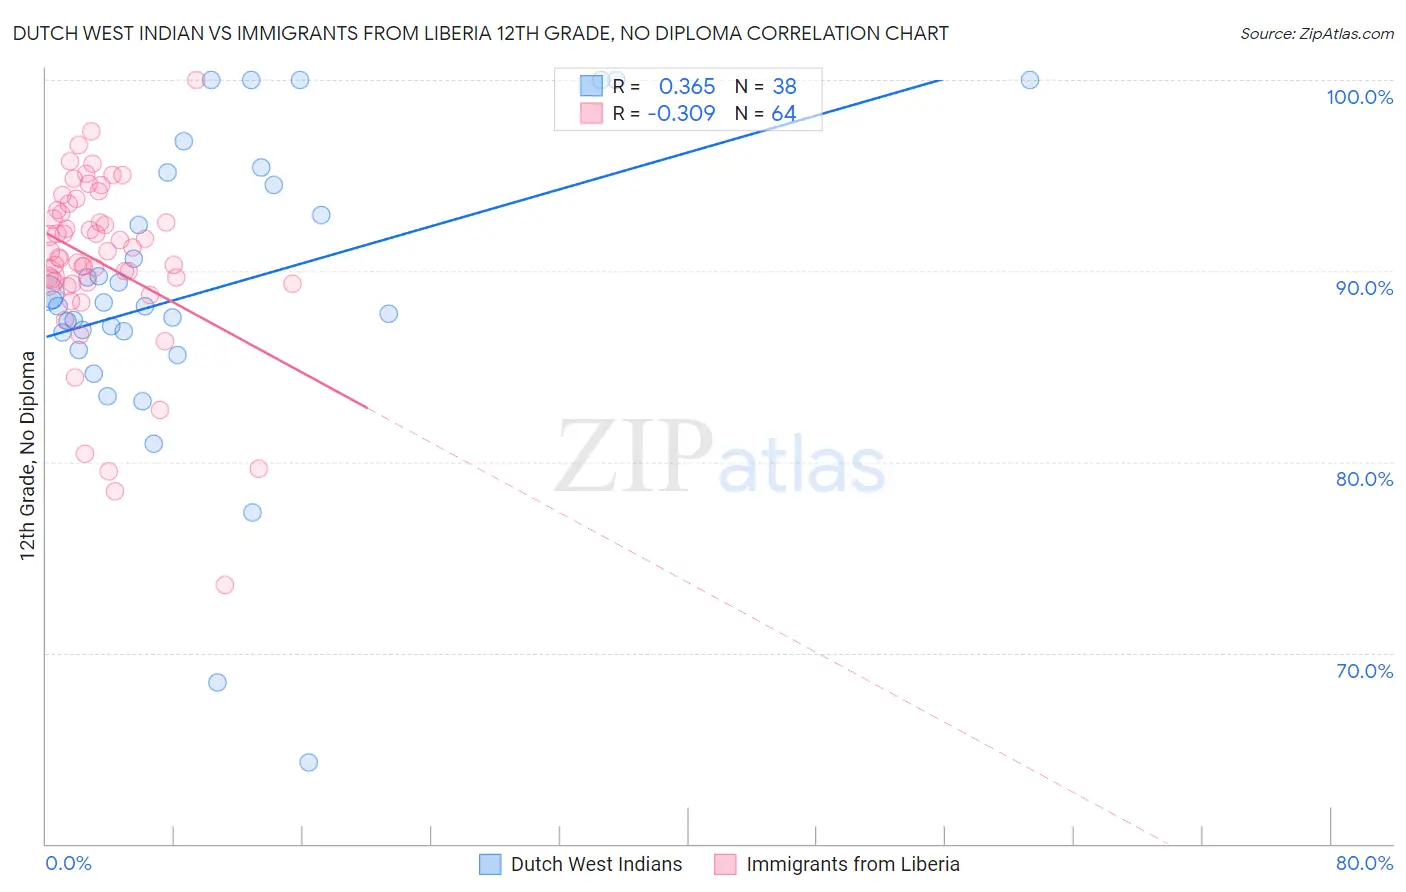
Dutch West Indian vs Immigrants from Liberia 12th Grade, No Diploma Correlation Chart
The statistical analysis conducted on geographies consisting of 85,776,098 people shows a mild positive correlation between the proportion of Dutch West Indians and percentage of population with at least 12th grade (no diploma) education in the United States with a correlation coefficient (R) of 0.365 and weighted average of 88.5%. Similarly, the statistical analysis conducted on geographies consisting of 135,293,967 people shows a mild negative correlation between the proportion of Immigrants from Liberia and percentage of population with at least 12th grade (no diploma) education in the United States with a correlation coefficient (R) of -0.309 and weighted average of 90.4%, a difference of 2.1%.
12th Grade, No Diploma Correlation Summary
| Measurement | Dutch West Indian | Immigrants from Liberia |
| Minimum | 64.3% | 73.6% |
| Maximum | 100.0% | 100.0% |
| Range | 35.7% | 26.4% |
| Mean | 88.9% | 90.4% |
| Median | 88.2% | 90.9% |
| Interquartile 25% (IQ1) | 86.8% | 89.4% |
| Interquartile 75% (IQ3) | 94.5% | 93.1% |
| Interquartile Range (IQR) | 7.7% | 3.7% |
| Standard Deviation (Sample) | 7.9% | 4.7% |
| Standard Deviation (Population) | 7.8% | 4.6% |
Similar Demographics by 12th Grade, No Diploma
Demographics Similar to Dutch West Indians by 12th Grade, No Diploma
In terms of 12th grade, no diploma, the demographic groups most similar to Dutch West Indians are British West Indian (88.5%, a difference of 0.0%), Haitian (88.5%, a difference of 0.0%), Immigrants from Fiji (88.6%, a difference of 0.10%), Immigrants from West Indies (88.6%, a difference of 0.11%), and Hopi (88.6%, a difference of 0.11%).
| Demographics | Rating | Rank | 12th Grade, No Diploma |
| Immigrants | Vietnam | 0.0 /100 | #282 | Tragic 88.7% |
| Paiute | 0.0 /100 | #283 | Tragic 88.7% |
| Pennsylvania Germans | 0.0 /100 | #284 | Tragic 88.7% |
| Indonesians | 0.0 /100 | #285 | Tragic 88.6% |
| Immigrants | West Indies | 0.0 /100 | #286 | Tragic 88.6% |
| Hopi | 0.0 /100 | #287 | Tragic 88.6% |
| Immigrants | Fiji | 0.0 /100 | #288 | Tragic 88.6% |
| Dutch West Indians | 0.0 /100 | #289 | Tragic 88.5% |
| British West Indians | 0.0 /100 | #290 | Tragic 88.5% |
| Haitians | 0.0 /100 | #291 | Tragic 88.5% |
| Immigrants | Grenada | 0.0 /100 | #292 | Tragic 88.4% |
| Japanese | 0.0 /100 | #293 | Tragic 88.3% |
| Guyanese | 0.0 /100 | #294 | Tragic 88.3% |
| Immigrants | Immigrants | 0.0 /100 | #295 | Tragic 88.2% |
| Fijians | 0.0 /100 | #296 | Tragic 88.2% |
Demographics Similar to Immigrants from Liberia by 12th Grade, No Diploma
In terms of 12th grade, no diploma, the demographic groups most similar to Immigrants from Liberia are Immigrants from Somalia (90.4%, a difference of 0.020%), South American (90.3%, a difference of 0.040%), Colombian (90.4%, a difference of 0.050%), Immigrants from Panama (90.3%, a difference of 0.060%), and Chickasaw (90.3%, a difference of 0.060%).
| Demographics | Rating | Rank | 12th Grade, No Diploma |
| Immigrants | Africa | 8.5 /100 | #214 | Tragic 90.5% |
| Arapaho | 7.7 /100 | #215 | Tragic 90.5% |
| Shoshone | 7.5 /100 | #216 | Tragic 90.5% |
| Cherokee | 7.4 /100 | #217 | Tragic 90.5% |
| Immigrants | Cameroon | 7.4 /100 | #218 | Tragic 90.5% |
| Uruguayans | 7.0 /100 | #219 | Tragic 90.4% |
| Colombians | 6.6 /100 | #220 | Tragic 90.4% |
| Immigrants | Liberia | 5.7 /100 | #221 | Tragic 90.4% |
| Immigrants | Somalia | 5.3 /100 | #222 | Tragic 90.4% |
| South Americans | 5.0 /100 | #223 | Tragic 90.3% |
| Immigrants | Panama | 4.8 /100 | #224 | Tragic 90.3% |
| Chickasaw | 4.8 /100 | #225 | Tragic 90.3% |
| Immigrants | Zaire | 4.6 /100 | #226 | Tragic 90.3% |
| Nigerians | 4.5 /100 | #227 | Tragic 90.3% |
| Creek | 3.9 /100 | #228 | Tragic 90.3% |