Dutch West Indian vs Alaska Native Unemployment Among Ages 60 to 64 years
COMPARE
Dutch West Indian
Alaska Native
Unemployment Among Ages 60 to 64 years
Unemployment Among Ages 60 to 64 years Comparison
Dutch West Indians
Alaska Natives
5.7%
UNEMPLOYMENT AMONG AGES 60 TO 64 YEARS
0.0/ 100
METRIC RATING
321st/ 347
METRIC RANK
7.6%
UNEMPLOYMENT AMONG AGES 60 TO 64 YEARS
0.0/ 100
METRIC RATING
344th/ 347
METRIC RANK
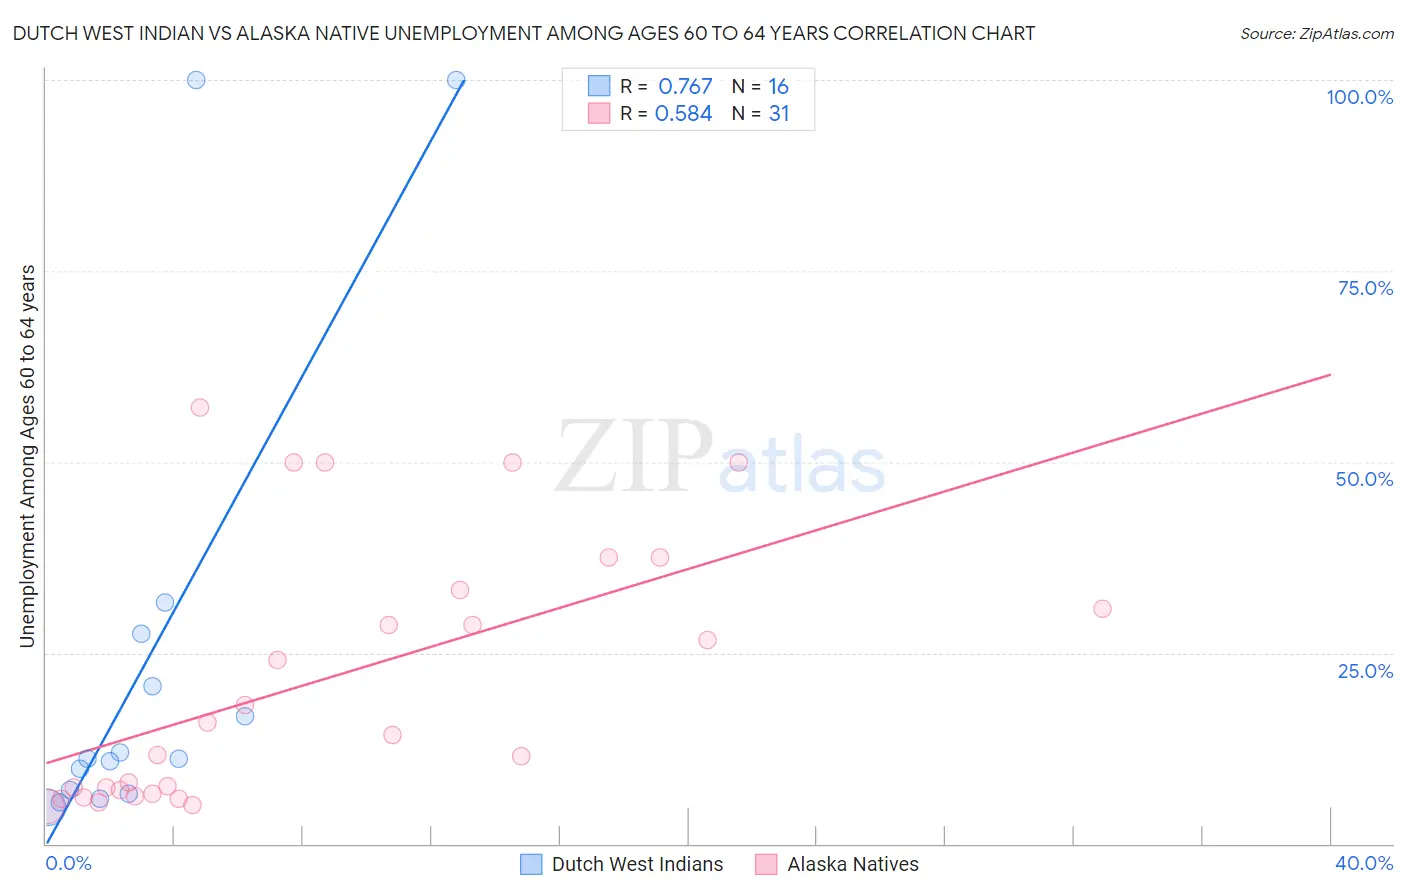
Dutch West Indian vs Alaska Native Unemployment Among Ages 60 to 64 years Correlation Chart
The statistical analysis conducted on geographies consisting of 80,557,093 people shows a strong positive correlation between the proportion of Dutch West Indians and unemployment rate among population between the ages 60 and 64 in the United States with a correlation coefficient (R) of 0.767 and weighted average of 5.7%. Similarly, the statistical analysis conducted on geographies consisting of 73,898,617 people shows a substantial positive correlation between the proportion of Alaska Natives and unemployment rate among population between the ages 60 and 64 in the United States with a correlation coefficient (R) of 0.584 and weighted average of 7.6%, a difference of 33.0%.
Unemployment Among Ages 60 to 64 years Correlation Summary
| Measurement | Dutch West Indian | Alaska Native |
| Minimum | 4.8% | 4.8% |
| Maximum | 100.0% | 57.1% |
| Range | 95.2% | 52.3% |
| Mean | 23.8% | 21.3% |
| Median | 11.1% | 14.3% |
| Interquartile 25% (IQ1) | 6.8% | 6.5% |
| Interquartile 75% (IQ3) | 24.1% | 33.3% |
| Interquartile Range (IQR) | 17.3% | 26.8% |
| Standard Deviation (Sample) | 30.7% | 17.0% |
| Standard Deviation (Population) | 29.8% | 16.7% |
Similar Demographics by Unemployment Among Ages 60 to 64 years
Demographics Similar to Dutch West Indians by Unemployment Among Ages 60 to 64 years
In terms of unemployment among ages 60 to 64 years, the demographic groups most similar to Dutch West Indians are Colville (5.7%, a difference of 0.050%), Ecuadorian (5.8%, a difference of 0.39%), Immigrants from Belize (5.7%, a difference of 0.82%), Alsatian (5.8%, a difference of 1.0%), and Native/Alaskan (5.7%, a difference of 1.3%).
| Demographics | Rating | Rank | Unemployment Among Ages 60 to 64 years |
| Guyanese | 0.0 /100 | #314 | Tragic 5.5% |
| Cree | 0.0 /100 | #315 | Tragic 5.6% |
| Cheyenne | 0.0 /100 | #316 | Tragic 5.6% |
| Shoshone | 0.0 /100 | #317 | Tragic 5.7% |
| Natives/Alaskans | 0.0 /100 | #318 | Tragic 5.7% |
| Immigrants | Belize | 0.0 /100 | #319 | Tragic 5.7% |
| Colville | 0.0 /100 | #320 | Tragic 5.7% |
| Dutch West Indians | 0.0 /100 | #321 | Tragic 5.7% |
| Ecuadorians | 0.0 /100 | #322 | Tragic 5.8% |
| Alsatians | 0.0 /100 | #323 | Tragic 5.8% |
| Immigrants | Ecuador | 0.0 /100 | #324 | Tragic 5.8% |
| Paiute | 0.0 /100 | #325 | Tragic 5.8% |
| Immigrants | St. Vincent and the Grenadines | 0.0 /100 | #326 | Tragic 5.9% |
| Immigrants | Grenada | 0.0 /100 | #327 | Tragic 5.9% |
| Apache | 0.0 /100 | #328 | Tragic 6.0% |
Demographics Similar to Alaska Natives by Unemployment Among Ages 60 to 64 years
In terms of unemployment among ages 60 to 64 years, the demographic groups most similar to Alaska Natives are Alaskan Athabascan (8.4%, a difference of 10.0%), Immigrants from Yemen (6.8%, a difference of 11.7%), Aleut (6.8%, a difference of 12.5%), Yuman (6.8%, a difference of 12.5%), and Pueblo (6.7%, a difference of 13.1%).
| Demographics | Rating | Rank | Unemployment Among Ages 60 to 64 years |
| Immigrants | Dominican Republic | 0.0 /100 | #333 | Tragic 6.0% |
| Puerto Ricans | 0.0 /100 | #334 | Tragic 6.1% |
| Vietnamese | 0.0 /100 | #335 | Tragic 6.1% |
| Kiowa | 0.0 /100 | #336 | Tragic 6.2% |
| Navajo | 0.0 /100 | #337 | Tragic 6.3% |
| Arapaho | 0.0 /100 | #338 | Tragic 6.3% |
| Tlingit-Haida | 0.0 /100 | #339 | Tragic 6.4% |
| Pueblo | 0.0 /100 | #340 | Tragic 6.7% |
| Yuman | 0.0 /100 | #341 | Tragic 6.8% |
| Aleuts | 0.0 /100 | #342 | Tragic 6.8% |
| Immigrants | Yemen | 0.0 /100 | #343 | Tragic 6.8% |
| Alaska Natives | 0.0 /100 | #344 | Tragic 7.6% |
| Alaskan Athabascans | 0.0 /100 | #345 | Tragic 8.4% |
| Inupiat | 0.0 /100 | #346 | Tragic 9.6% |
| Yup'ik | 0.0 /100 | #347 | Tragic 11.9% |