Dutch vs Portuguese 5th Grade
COMPARE
Dutch
Portuguese
5th Grade
5th Grade Comparison
Dutch
Portuguese
98.3%
5TH GRADE
100.0/ 100
METRIC RATING
14th/ 347
METRIC RANK
97.1%
5TH GRADE
7.8/ 100
METRIC RATING
213th/ 347
METRIC RANK
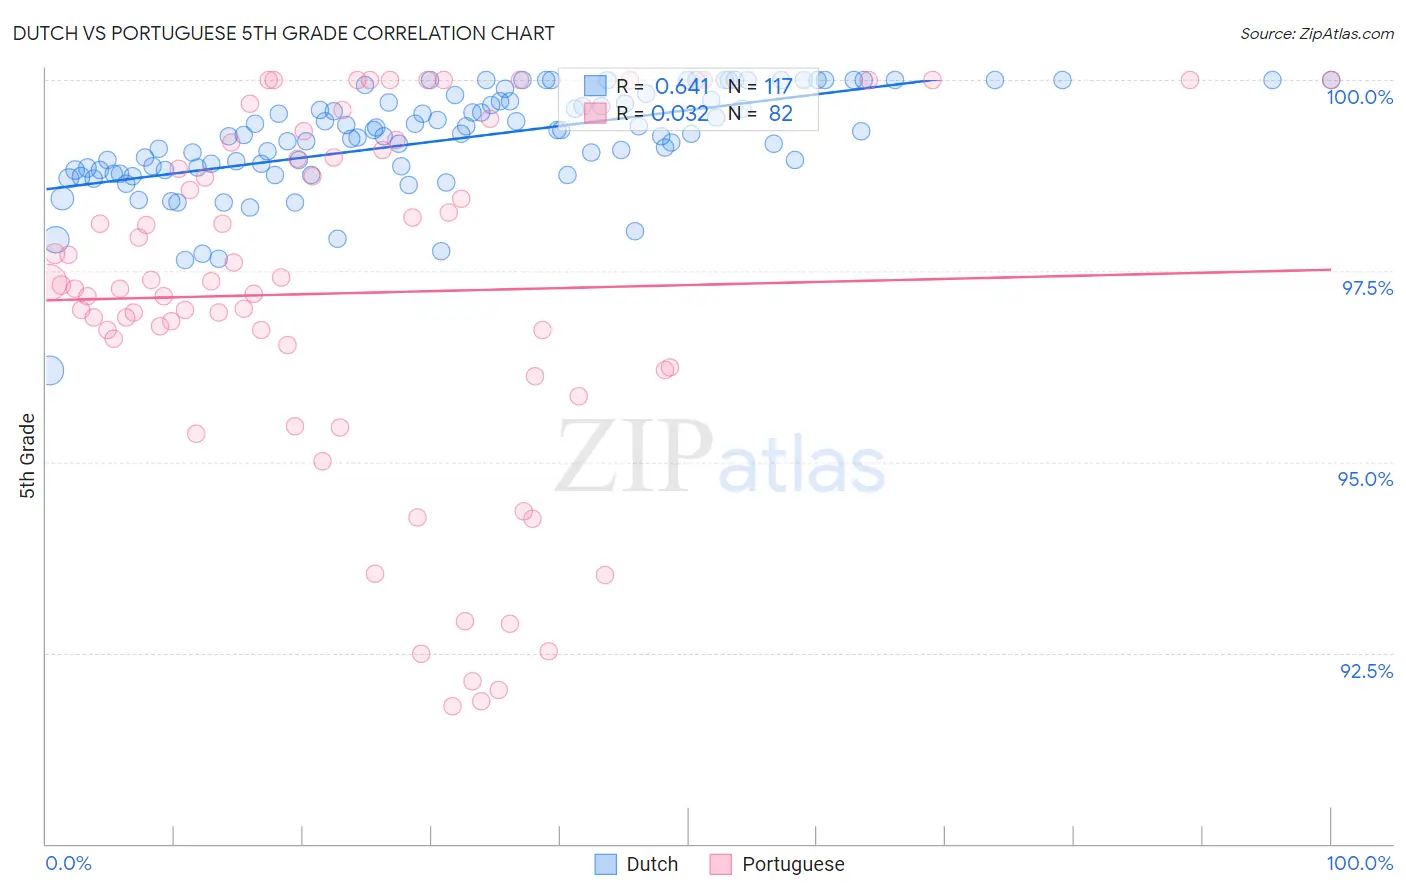
Dutch vs Portuguese 5th Grade Correlation Chart
The statistical analysis conducted on geographies consisting of 554,359,260 people shows a significant positive correlation between the proportion of Dutch and percentage of population with at least 5th grade education in the United States with a correlation coefficient (R) of 0.641 and weighted average of 98.3%. Similarly, the statistical analysis conducted on geographies consisting of 450,351,764 people shows no correlation between the proportion of Portuguese and percentage of population with at least 5th grade education in the United States with a correlation coefficient (R) of 0.032 and weighted average of 97.1%, a difference of 1.2%.
5th Grade Correlation Summary
| Measurement | Dutch | Portuguese |
| Minimum | 96.2% | 91.8% |
| Maximum | 100.0% | 100.0% |
| Range | 3.8% | 8.2% |
| Mean | 99.2% | 97.2% |
| Median | 99.3% | 97.3% |
| Interquartile 25% (IQ1) | 98.8% | 96.2% |
| Interquartile 75% (IQ3) | 99.7% | 99.1% |
| Interquartile Range (IQR) | 0.90% | 2.8% |
| Standard Deviation (Sample) | 0.67% | 2.3% |
| Standard Deviation (Population) | 0.67% | 2.3% |
Similar Demographics by 5th Grade
Demographics Similar to Dutch by 5th Grade
In terms of 5th grade, the demographic groups most similar to Dutch are Tlingit-Haida (98.3%, a difference of 0.010%), Scottish (98.3%, a difference of 0.010%), Polish (98.3%, a difference of 0.010%), Carpatho Rusyn (98.3%, a difference of 0.020%), and Irish (98.3%, a difference of 0.020%).
| Demographics | Rating | Rank | 5th Grade |
| Inupiat | 100.0 /100 | #7 | Exceptional 98.4% |
| Slovenes | 100.0 /100 | #8 | Exceptional 98.3% |
| Swedes | 100.0 /100 | #9 | Exceptional 98.3% |
| English | 100.0 /100 | #10 | Exceptional 98.3% |
| Alaskan Athabascans | 100.0 /100 | #11 | Exceptional 98.3% |
| Carpatho Rusyns | 100.0 /100 | #12 | Exceptional 98.3% |
| Tlingit-Haida | 100.0 /100 | #13 | Exceptional 98.3% |
| Dutch | 100.0 /100 | #14 | Exceptional 98.3% |
| Scottish | 100.0 /100 | #15 | Exceptional 98.3% |
| Poles | 100.0 /100 | #16 | Exceptional 98.3% |
| Irish | 100.0 /100 | #17 | Exceptional 98.3% |
| Pennsylvania Germans | 100.0 /100 | #18 | Exceptional 98.3% |
| Finns | 100.0 /100 | #19 | Exceptional 98.2% |
| Lithuanians | 100.0 /100 | #20 | Exceptional 98.2% |
| Danes | 100.0 /100 | #21 | Exceptional 98.2% |
Demographics Similar to Portuguese by 5th Grade
In terms of 5th grade, the demographic groups most similar to Portuguese are Costa Rican (97.1%, a difference of 0.0%), Immigrants from Morocco (97.1%, a difference of 0.0%), Samoan (97.1%, a difference of 0.010%), Immigrants from Iraq (97.1%, a difference of 0.010%), and Sudanese (97.1%, a difference of 0.010%).
| Demographics | Rating | Rank | 5th Grade |
| Paiute | 11.6 /100 | #206 | Poor 97.1% |
| Iraqis | 10.9 /100 | #207 | Poor 97.1% |
| Laotians | 10.8 /100 | #208 | Poor 97.1% |
| Immigrants | Nepal | 10.3 /100 | #209 | Poor 97.1% |
| Immigrants | Oceania | 10.0 /100 | #210 | Poor 97.1% |
| Samoans | 8.5 /100 | #211 | Tragic 97.1% |
| Immigrants | Iraq | 8.3 /100 | #212 | Tragic 97.1% |
| Portuguese | 7.8 /100 | #213 | Tragic 97.1% |
| Costa Ricans | 7.7 /100 | #214 | Tragic 97.1% |
| Immigrants | Morocco | 7.5 /100 | #215 | Tragic 97.1% |
| Sudanese | 7.0 /100 | #216 | Tragic 97.1% |
| Immigrants | Lebanon | 6.8 /100 | #217 | Tragic 97.1% |
| Immigrants | Sudan | 6.5 /100 | #218 | Tragic 97.1% |
| Immigrants | Syria | 6.4 /100 | #219 | Tragic 97.1% |
| Immigrants | Southern Europe | 6.3 /100 | #220 | Tragic 97.1% |