Honduran vs Immigrants from Jamaica 8th Grade
COMPARE
Honduran
Immigrants from Jamaica
8th Grade
8th Grade Comparison
Hondurans
Immigrants from Jamaica
92.3%
8TH GRADE
0.0/ 100
METRIC RATING
331st/ 347
METRIC RANK
94.9%
8TH GRADE
0.6/ 100
METRIC RATING
260th/ 347
METRIC RANK
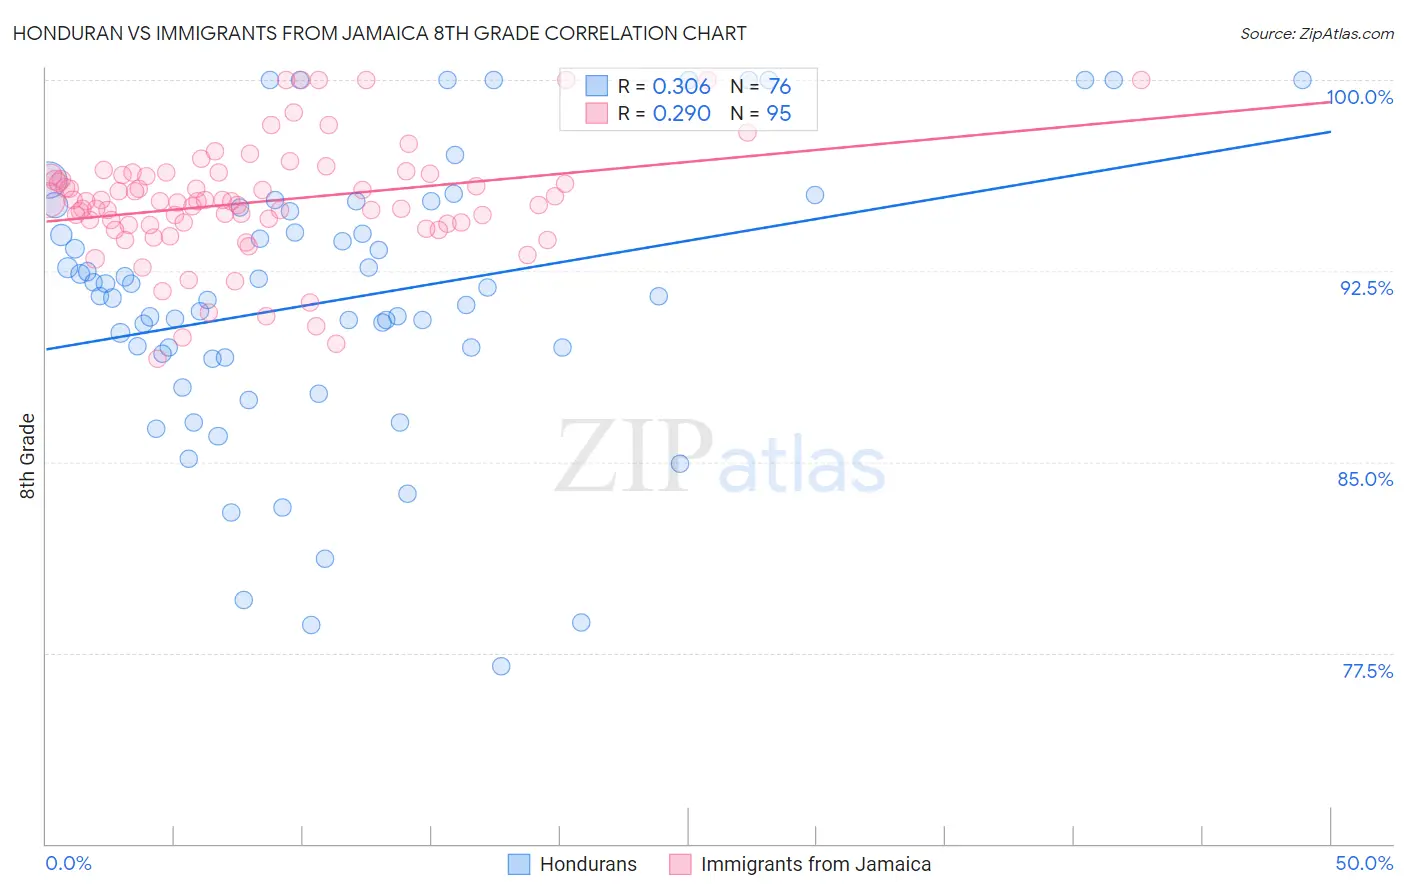
Honduran vs Immigrants from Jamaica 8th Grade Correlation Chart
The statistical analysis conducted on geographies consisting of 357,784,803 people shows a mild positive correlation between the proportion of Hondurans and percentage of population with at least 8th grade education in the United States with a correlation coefficient (R) of 0.306 and weighted average of 92.3%. Similarly, the statistical analysis conducted on geographies consisting of 301,829,550 people shows a weak positive correlation between the proportion of Immigrants from Jamaica and percentage of population with at least 8th grade education in the United States with a correlation coefficient (R) of 0.290 and weighted average of 94.9%, a difference of 2.8%.
8th Grade Correlation Summary
| Measurement | Honduran | Immigrants from Jamaica |
| Minimum | 77.0% | 89.0% |
| Maximum | 100.0% | 100.0% |
| Range | 23.0% | 11.0% |
| Mean | 91.4% | 95.2% |
| Median | 91.5% | 95.2% |
| Interquartile 25% (IQ1) | 89.2% | 94.3% |
| Interquartile 75% (IQ3) | 94.9% | 96.3% |
| Interquartile Range (IQR) | 5.8% | 2.0% |
| Standard Deviation (Sample) | 5.4% | 2.3% |
| Standard Deviation (Population) | 5.4% | 2.3% |
Similar Demographics by 8th Grade
Demographics Similar to Hondurans by 8th Grade
In terms of 8th grade, the demographic groups most similar to Hondurans are Immigrants from Armenia (92.3%, a difference of 0.010%), Immigrants from Dominican Republic (92.3%, a difference of 0.020%), Immigrants from Cabo Verde (92.4%, a difference of 0.090%), Hispanic or Latino (92.2%, a difference of 0.13%), and Immigrants from Nicaragua (92.5%, a difference of 0.15%).
| Demographics | Rating | Rank | 8th Grade |
| Nepalese | 0.0 /100 | #324 | Tragic 92.8% |
| Dominicans | 0.0 /100 | #325 | Tragic 92.8% |
| Central American Indians | 0.0 /100 | #326 | Tragic 92.7% |
| Immigrants | Azores | 0.0 /100 | #327 | Tragic 92.5% |
| Immigrants | Nicaragua | 0.0 /100 | #328 | Tragic 92.5% |
| Immigrants | Cabo Verde | 0.0 /100 | #329 | Tragic 92.4% |
| Immigrants | Armenia | 0.0 /100 | #330 | Tragic 92.3% |
| Hondurans | 0.0 /100 | #331 | Tragic 92.3% |
| Immigrants | Dominican Republic | 0.0 /100 | #332 | Tragic 92.3% |
| Hispanics or Latinos | 0.0 /100 | #333 | Tragic 92.2% |
| Immigrants | Yemen | 0.0 /100 | #334 | Tragic 92.1% |
| Mexican American Indians | 0.0 /100 | #335 | Tragic 92.1% |
| Immigrants | Honduras | 0.0 /100 | #336 | Tragic 91.9% |
| Immigrants | Latin America | 0.0 /100 | #337 | Tragic 91.7% |
| Central Americans | 0.0 /100 | #338 | Tragic 91.6% |
Demographics Similar to Immigrants from Jamaica by 8th Grade
In terms of 8th grade, the demographic groups most similar to Immigrants from Jamaica are Ghanaian (94.9%, a difference of 0.0%), Immigrants from Congo (94.9%, a difference of 0.010%), Afghan (94.9%, a difference of 0.020%), Colombian (95.0%, a difference of 0.030%), and Immigrants from Somalia (95.0%, a difference of 0.040%).
| Demographics | Rating | Rank | 8th Grade |
| U.S. Virgin Islanders | 0.9 /100 | #253 | Tragic 95.0% |
| Immigrants | Cameroon | 0.8 /100 | #254 | Tragic 95.0% |
| Immigrants | Somalia | 0.7 /100 | #255 | Tragic 95.0% |
| Colombians | 0.7 /100 | #256 | Tragic 95.0% |
| Afghans | 0.6 /100 | #257 | Tragic 94.9% |
| Immigrants | Congo | 0.6 /100 | #258 | Tragic 94.9% |
| Ghanaians | 0.6 /100 | #259 | Tragic 94.9% |
| Immigrants | Jamaica | 0.6 /100 | #260 | Tragic 94.9% |
| Immigrants | Costa Rica | 0.5 /100 | #261 | Tragic 94.9% |
| Immigrants | Nigeria | 0.4 /100 | #262 | Tragic 94.9% |
| Immigrants | Hong Kong | 0.4 /100 | #263 | Tragic 94.9% |
| South Americans | 0.4 /100 | #264 | Tragic 94.9% |
| Yuman | 0.4 /100 | #265 | Tragic 94.9% |
| West Indians | 0.3 /100 | #266 | Tragic 94.8% |
| Immigrants | Ghana | 0.3 /100 | #267 | Tragic 94.8% |