Dominican vs Ethiopian 1st Grade
COMPARE
Dominican
Ethiopian
1st Grade
1st Grade Comparison
Dominicans
Ethiopians
96.7%
1ST GRADE
0.0/ 100
METRIC RATING
325th/ 347
METRIC RANK
97.6%
1ST GRADE
0.9/ 100
METRIC RATING
250th/ 347
METRIC RANK
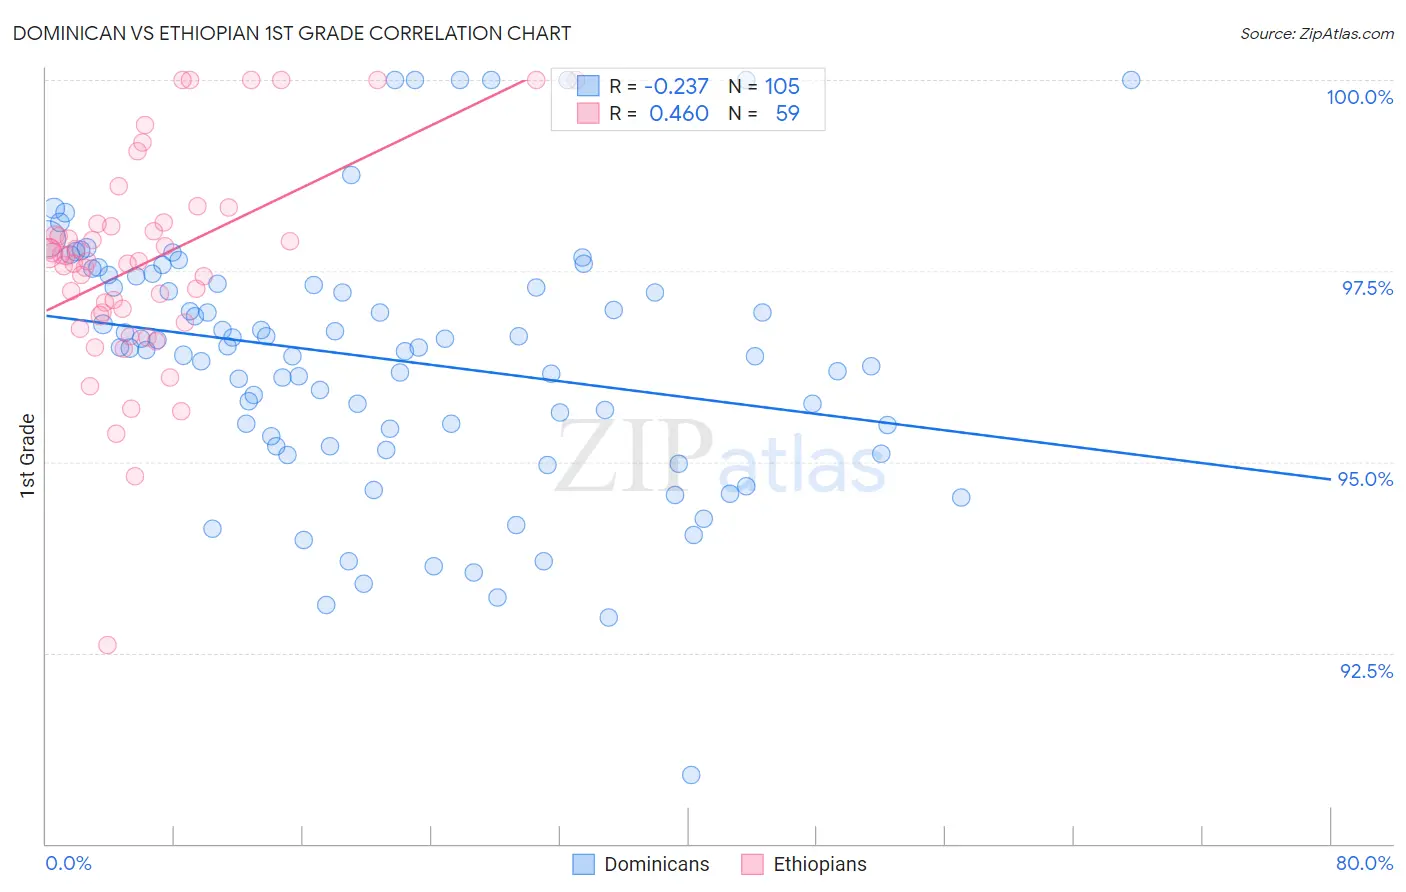
Dominican vs Ethiopian 1st Grade Correlation Chart
The statistical analysis conducted on geographies consisting of 355,142,603 people shows a weak negative correlation between the proportion of Dominicans and percentage of population with at least 1st grade education in the United States with a correlation coefficient (R) of -0.237 and weighted average of 96.7%. Similarly, the statistical analysis conducted on geographies consisting of 223,220,814 people shows a moderate positive correlation between the proportion of Ethiopians and percentage of population with at least 1st grade education in the United States with a correlation coefficient (R) of 0.460 and weighted average of 97.6%, a difference of 0.86%.
1st Grade Correlation Summary
| Measurement | Dominican | Ethiopian |
| Minimum | 90.9% | 92.6% |
| Maximum | 100.0% | 100.0% |
| Range | 9.1% | 7.4% |
| Mean | 96.4% | 97.6% |
| Median | 96.5% | 97.6% |
| Interquartile 25% (IQ1) | 95.3% | 96.9% |
| Interquartile 75% (IQ3) | 97.4% | 98.1% |
| Interquartile Range (IQR) | 2.1% | 1.2% |
| Standard Deviation (Sample) | 1.7% | 1.4% |
| Standard Deviation (Population) | 1.7% | 1.4% |
Similar Demographics by 1st Grade
Demographics Similar to Dominicans by 1st Grade
In terms of 1st grade, the demographic groups most similar to Dominicans are Indonesian (96.7%, a difference of 0.0%), Vietnamese (96.8%, a difference of 0.020%), Immigrants from Honduras (96.8%, a difference of 0.030%), Mexican American Indian (96.8%, a difference of 0.040%), and Immigrants from Burma/Myanmar (96.8%, a difference of 0.060%).
| Demographics | Rating | Rank | 1st Grade |
| Immigrants | Laos | 0.0 /100 | #318 | Tragic 96.8% |
| Immigrants | Guyana | 0.0 /100 | #319 | Tragic 96.8% |
| Immigrants | Burma/Myanmar | 0.0 /100 | #320 | Tragic 96.8% |
| Immigrants | Bangladesh | 0.0 /100 | #321 | Tragic 96.8% |
| Mexican American Indians | 0.0 /100 | #322 | Tragic 96.8% |
| Immigrants | Honduras | 0.0 /100 | #323 | Tragic 96.8% |
| Vietnamese | 0.0 /100 | #324 | Tragic 96.8% |
| Dominicans | 0.0 /100 | #325 | Tragic 96.7% |
| Indonesians | 0.0 /100 | #326 | Tragic 96.7% |
| Mexicans | 0.0 /100 | #327 | Tragic 96.7% |
| Immigrants | Latin America | 0.0 /100 | #328 | Tragic 96.7% |
| Japanese | 0.0 /100 | #329 | Tragic 96.6% |
| Immigrants | Vietnam | 0.0 /100 | #330 | Tragic 96.6% |
| Immigrants | Armenia | 0.0 /100 | #331 | Tragic 96.6% |
| Central Americans | 0.0 /100 | #332 | Tragic 96.5% |
Demographics Similar to Ethiopians by 1st Grade
In terms of 1st grade, the demographic groups most similar to Ethiopians are Immigrants from Iraq (97.6%, a difference of 0.0%), South American (97.6%, a difference of 0.010%), Immigrants from Eastern Africa (97.6%, a difference of 0.010%), Peruvian (97.6%, a difference of 0.010%), and Immigrants from Middle Africa (97.6%, a difference of 0.010%).
| Demographics | Rating | Rank | 1st Grade |
| Bolivians | 1.2 /100 | #243 | Tragic 97.6% |
| Asians | 1.1 /100 | #244 | Tragic 97.6% |
| South Americans | 1.1 /100 | #245 | Tragic 97.6% |
| Immigrants | Eastern Africa | 1.0 /100 | #246 | Tragic 97.6% |
| Peruvians | 1.0 /100 | #247 | Tragic 97.6% |
| Immigrants | Middle Africa | 1.0 /100 | #248 | Tragic 97.6% |
| Immigrants | Senegal | 1.0 /100 | #249 | Tragic 97.6% |
| Ethiopians | 0.9 /100 | #250 | Tragic 97.6% |
| Immigrants | Iraq | 0.9 /100 | #251 | Tragic 97.6% |
| Immigrants | Africa | 0.9 /100 | #252 | Tragic 97.6% |
| Immigrants | Congo | 0.7 /100 | #253 | Tragic 97.5% |
| Immigrants | Asia | 0.7 /100 | #254 | Tragic 97.5% |
| Immigrants | Colombia | 0.6 /100 | #255 | Tragic 97.5% |
| Jamaicans | 0.6 /100 | #256 | Tragic 97.5% |
| Yaqui | 0.6 /100 | #257 | Tragic 97.5% |