Immigrants from Serbia vs Immigrants from Hungary High School Diploma
COMPARE
Immigrants from Serbia
Immigrants from Hungary
High School Diploma
High School Diploma Comparison
Immigrants from Serbia
Immigrants from Hungary
90.5%
HIGH SCHOOL DIPLOMA
98.4/ 100
METRIC RATING
96th/ 347
METRIC RANK
90.2%
HIGH SCHOOL DIPLOMA
95.8/ 100
METRIC RATING
115th/ 347
METRIC RANK
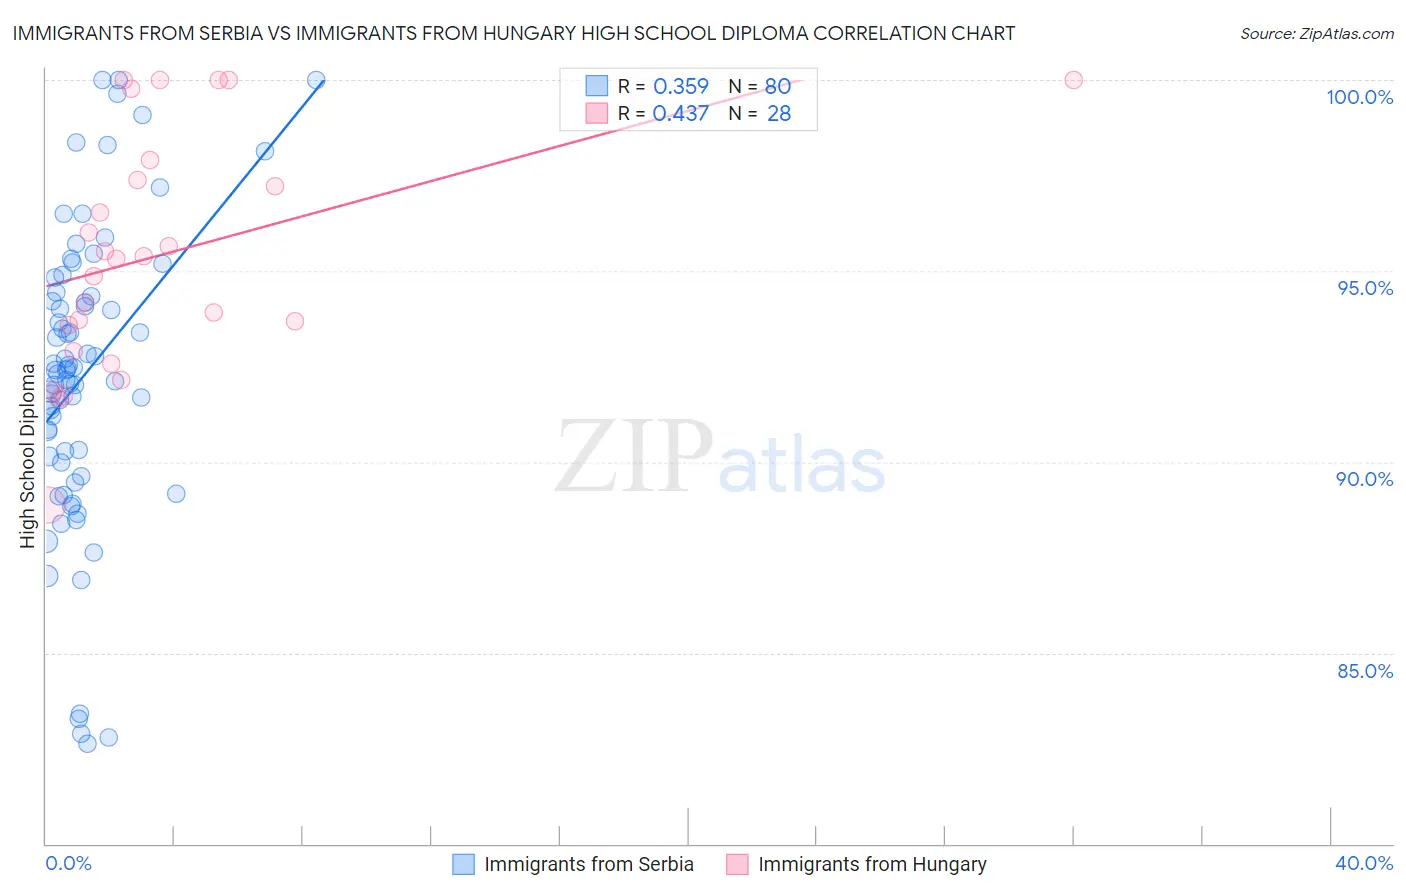
Immigrants from Serbia vs Immigrants from Hungary High School Diploma Correlation Chart
The statistical analysis conducted on geographies consisting of 131,745,658 people shows a mild positive correlation between the proportion of Immigrants from Serbia and percentage of population with at least high school diploma education in the United States with a correlation coefficient (R) of 0.359 and weighted average of 90.5%. Similarly, the statistical analysis conducted on geographies consisting of 195,707,305 people shows a moderate positive correlation between the proportion of Immigrants from Hungary and percentage of population with at least high school diploma education in the United States with a correlation coefficient (R) of 0.437 and weighted average of 90.2%, a difference of 0.37%.
High School Diploma Correlation Summary
| Measurement | Immigrants from Serbia | Immigrants from Hungary |
| Minimum | 82.6% | 88.9% |
| Maximum | 100.0% | 100.0% |
| Range | 17.4% | 11.1% |
| Mean | 92.3% | 95.4% |
| Median | 92.4% | 95.4% |
| Interquartile 25% (IQ1) | 90.1% | 93.2% |
| Interquartile 75% (IQ3) | 94.4% | 97.6% |
| Interquartile Range (IQR) | 4.3% | 4.4% |
| Standard Deviation (Sample) | 3.9% | 3.1% |
| Standard Deviation (Population) | 3.9% | 3.1% |
Demographics Similar to Immigrants from Serbia and Immigrants from Hungary by High School Diploma
In terms of high school diploma, the demographic groups most similar to Immigrants from Serbia are Icelander (90.5%, a difference of 0.010%), Immigrants from Kuwait (90.5%, a difference of 0.030%), Immigrants from Korea (90.5%, a difference of 0.030%), Immigrants from Europe (90.5%, a difference of 0.050%), and Immigrants from North Macedonia (90.5%, a difference of 0.060%). Similarly, the demographic groups most similar to Immigrants from Hungary are Yugoslavian (90.2%, a difference of 0.040%), Immigrants from Sri Lanka (90.2%, a difference of 0.050%), Immigrants from Belarus (90.2%, a difference of 0.060%), Immigrants from Greece (90.3%, a difference of 0.080%), and Menominee (90.3%, a difference of 0.080%).
| Demographics | Rating | Rank | High School Diploma |
| Icelanders | 98.5 /100 | #95 | Exceptional 90.5% |
| Immigrants | Serbia | 98.4 /100 | #96 | Exceptional 90.5% |
| Immigrants | Kuwait | 98.3 /100 | #97 | Exceptional 90.5% |
| Immigrants | Korea | 98.3 /100 | #98 | Exceptional 90.5% |
| Immigrants | Europe | 98.2 /100 | #99 | Exceptional 90.5% |
| Immigrants | North Macedonia | 98.1 /100 | #100 | Exceptional 90.5% |
| Immigrants | Norway | 98.0 /100 | #101 | Exceptional 90.5% |
| Aleuts | 98.0 /100 | #102 | Exceptional 90.4% |
| Immigrants | Romania | 97.8 /100 | #103 | Exceptional 90.4% |
| Immigrants | Croatia | 97.8 /100 | #104 | Exceptional 90.4% |
| Lebanese | 97.4 /100 | #105 | Exceptional 90.4% |
| Syrians | 97.0 /100 | #106 | Exceptional 90.3% |
| Immigrants | Russia | 96.9 /100 | #107 | Exceptional 90.3% |
| Palestinians | 96.7 /100 | #108 | Exceptional 90.3% |
| Immigrants | Zimbabwe | 96.7 /100 | #109 | Exceptional 90.3% |
| Immigrants | Greece | 96.6 /100 | #110 | Exceptional 90.3% |
| Menominee | 96.6 /100 | #111 | Exceptional 90.3% |
| Immigrants | Belarus | 96.4 /100 | #112 | Exceptional 90.2% |
| Immigrants | Sri Lanka | 96.3 /100 | #113 | Exceptional 90.2% |
| Yugoslavians | 96.2 /100 | #114 | Exceptional 90.2% |
| Immigrants | Hungary | 95.8 /100 | #115 | Exceptional 90.2% |