Danish vs Panamanian 7th Grade
COMPARE
Danish
Panamanian
7th Grade
7th Grade Comparison
Danes
Panamanians
97.4%
7TH GRADE
100.0/ 100
METRIC RATING
27th/ 347
METRIC RANK
95.9%
7TH GRADE
32.3/ 100
METRIC RATING
192nd/ 347
METRIC RANK
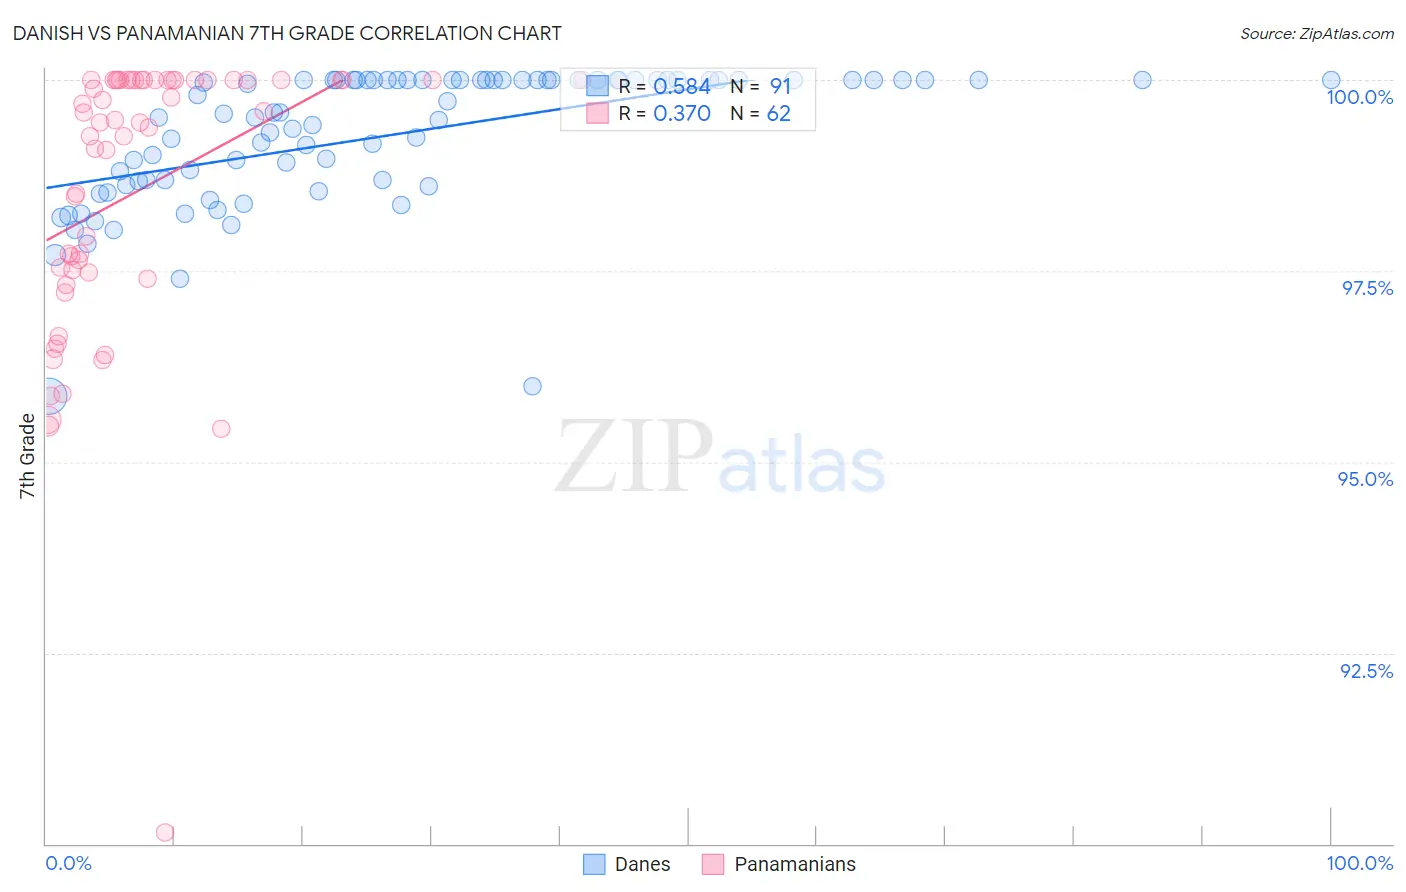
Danish vs Panamanian 7th Grade Correlation Chart
The statistical analysis conducted on geographies consisting of 474,193,610 people shows a substantial positive correlation between the proportion of Danes and percentage of population with at least 7th grade education in the United States with a correlation coefficient (R) of 0.584 and weighted average of 97.4%. Similarly, the statistical analysis conducted on geographies consisting of 281,248,945 people shows a mild positive correlation between the proportion of Panamanians and percentage of population with at least 7th grade education in the United States with a correlation coefficient (R) of 0.370 and weighted average of 95.9%, a difference of 1.5%.
7th Grade Correlation Summary
| Measurement | Danish | Panamanian |
| Minimum | 95.9% | 90.1% |
| Maximum | 100.0% | 100.0% |
| Range | 4.1% | 9.9% |
| Mean | 99.3% | 98.5% |
| Median | 99.6% | 99.5% |
| Interquartile 25% (IQ1) | 98.7% | 97.5% |
| Interquartile 75% (IQ3) | 100.0% | 100.0% |
| Interquartile Range (IQR) | 1.3% | 2.5% |
| Standard Deviation (Sample) | 0.89% | 1.9% |
| Standard Deviation (Population) | 0.89% | 1.8% |
Similar Demographics by 7th Grade
Demographics Similar to Danes by 7th Grade
In terms of 7th grade, the demographic groups most similar to Danes are Scotch-Irish (97.4%, a difference of 0.0%), Welsh (97.4%, a difference of 0.010%), French (97.4%, a difference of 0.010%), Croatian (97.4%, a difference of 0.020%), and Sioux (97.4%, a difference of 0.020%).
| Demographics | Rating | Rank | 7th Grade |
| Yup'ik | 100.0 /100 | #20 | Exceptional 97.4% |
| Inupiat | 100.0 /100 | #21 | Exceptional 97.4% |
| French Canadians | 100.0 /100 | #22 | Exceptional 97.4% |
| Croatians | 100.0 /100 | #23 | Exceptional 97.4% |
| Welsh | 100.0 /100 | #24 | Exceptional 97.4% |
| French | 100.0 /100 | #25 | Exceptional 97.4% |
| Scotch-Irish | 100.0 /100 | #26 | Exceptional 97.4% |
| Danes | 100.0 /100 | #27 | Exceptional 97.4% |
| Sioux | 100.0 /100 | #28 | Exceptional 97.4% |
| Scandinavians | 100.0 /100 | #29 | Exceptional 97.4% |
| Czechs | 100.0 /100 | #30 | Exceptional 97.4% |
| Europeans | 100.0 /100 | #31 | Exceptional 97.3% |
| Italians | 100.0 /100 | #32 | Exceptional 97.3% |
| Chippewa | 100.0 /100 | #33 | Exceptional 97.3% |
| Alaska Natives | 100.0 /100 | #34 | Exceptional 97.3% |
Demographics Similar to Panamanians by 7th Grade
In terms of 7th grade, the demographic groups most similar to Panamanians are Immigrants from Micronesia (95.9%, a difference of 0.0%), Liberian (95.9%, a difference of 0.0%), Immigrants from Egypt (95.9%, a difference of 0.010%), Immigrants from Venezuela (95.9%, a difference of 0.010%), and Immigrants from Bahamas (95.9%, a difference of 0.010%).
| Demographics | Rating | Rank | 7th Grade |
| Brazilians | 37.3 /100 | #185 | Fair 96.0% |
| Immigrants | Iraq | 36.1 /100 | #186 | Fair 96.0% |
| Immigrants | Uganda | 36.0 /100 | #187 | Fair 96.0% |
| Immigrants | Egypt | 34.3 /100 | #188 | Fair 95.9% |
| Immigrants | Venezuela | 33.9 /100 | #189 | Fair 95.9% |
| Immigrants | Micronesia | 32.6 /100 | #190 | Fair 95.9% |
| Liberians | 32.5 /100 | #191 | Fair 95.9% |
| Panamanians | 32.3 /100 | #192 | Fair 95.9% |
| Immigrants | Bahamas | 30.8 /100 | #193 | Fair 95.9% |
| Immigrants | Nepal | 30.0 /100 | #194 | Fair 95.9% |
| Sudanese | 28.1 /100 | #195 | Fair 95.9% |
| Apache | 27.6 /100 | #196 | Fair 95.9% |
| Immigrants | Zaire | 26.7 /100 | #197 | Fair 95.9% |
| Paraguayans | 24.8 /100 | #198 | Fair 95.9% |
| Guamanians/Chamorros | 23.5 /100 | #199 | Fair 95.9% |