Danish vs Immigrants from Malaysia 7th Grade
COMPARE
Danish
Immigrants from Malaysia
7th Grade
7th Grade Comparison
Danes
Immigrants from Malaysia
97.4%
7TH GRADE
100.0/ 100
METRIC RATING
27th/ 347
METRIC RANK
95.6%
7TH GRADE
6.2/ 100
METRIC RATING
225th/ 347
METRIC RANK
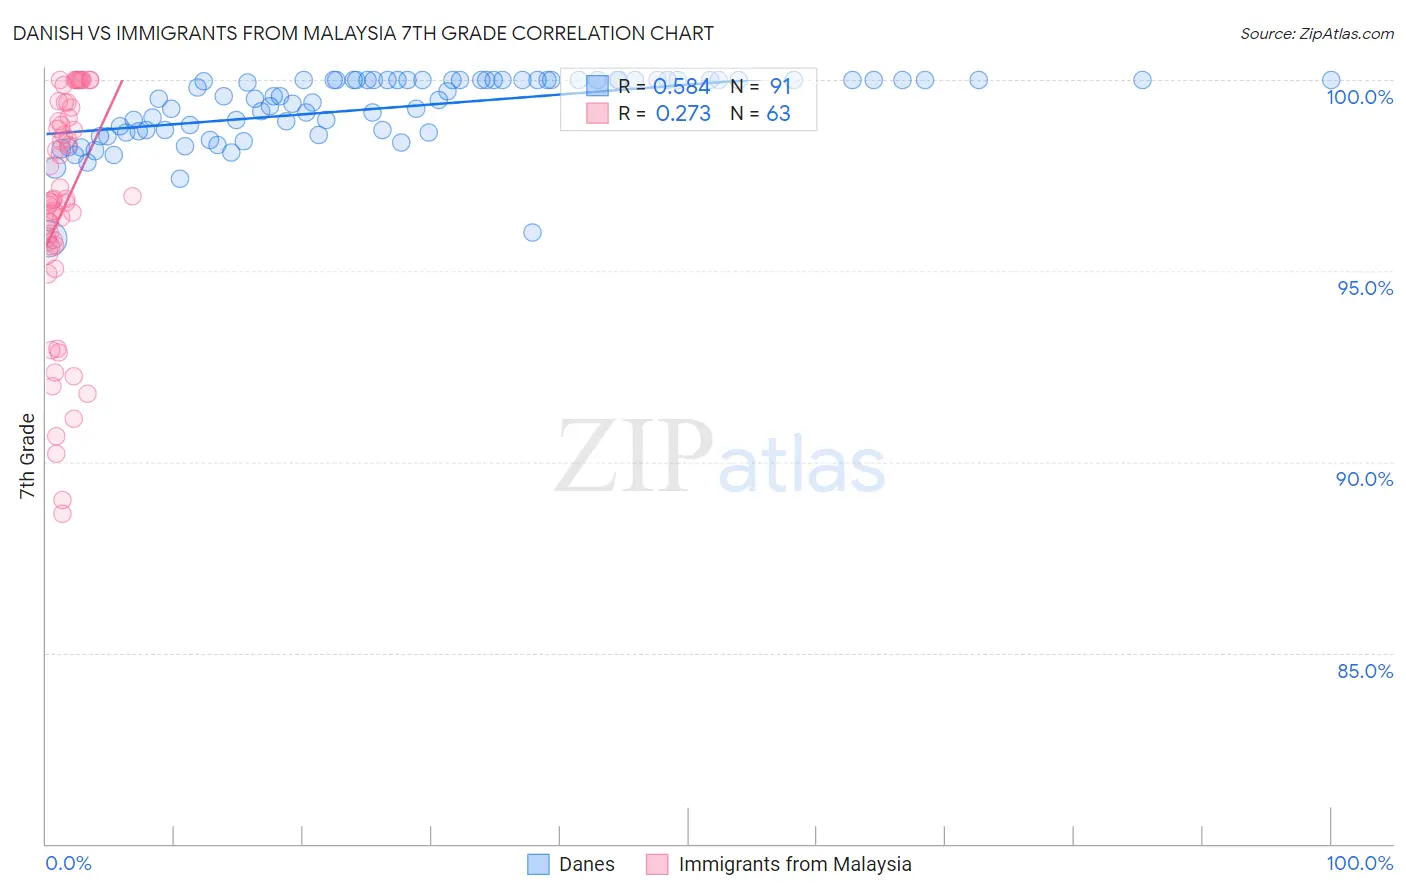
Danish vs Immigrants from Malaysia 7th Grade Correlation Chart
The statistical analysis conducted on geographies consisting of 474,193,610 people shows a substantial positive correlation between the proportion of Danes and percentage of population with at least 7th grade education in the United States with a correlation coefficient (R) of 0.584 and weighted average of 97.4%. Similarly, the statistical analysis conducted on geographies consisting of 197,973,709 people shows a weak positive correlation between the proportion of Immigrants from Malaysia and percentage of population with at least 7th grade education in the United States with a correlation coefficient (R) of 0.273 and weighted average of 95.6%, a difference of 1.8%.
7th Grade Correlation Summary
| Measurement | Danish | Immigrants from Malaysia |
| Minimum | 95.9% | 88.6% |
| Maximum | 100.0% | 100.0% |
| Range | 4.1% | 11.4% |
| Mean | 99.3% | 96.6% |
| Median | 99.6% | 96.8% |
| Interquartile 25% (IQ1) | 98.7% | 95.6% |
| Interquartile 75% (IQ3) | 100.0% | 99.0% |
| Interquartile Range (IQR) | 1.3% | 3.4% |
| Standard Deviation (Sample) | 0.89% | 3.0% |
| Standard Deviation (Population) | 0.89% | 3.0% |
Similar Demographics by 7th Grade
Demographics Similar to Danes by 7th Grade
In terms of 7th grade, the demographic groups most similar to Danes are Scotch-Irish (97.4%, a difference of 0.0%), Welsh (97.4%, a difference of 0.010%), French (97.4%, a difference of 0.010%), Croatian (97.4%, a difference of 0.020%), and Sioux (97.4%, a difference of 0.020%).
| Demographics | Rating | Rank | 7th Grade |
| Yup'ik | 100.0 /100 | #20 | Exceptional 97.4% |
| Inupiat | 100.0 /100 | #21 | Exceptional 97.4% |
| French Canadians | 100.0 /100 | #22 | Exceptional 97.4% |
| Croatians | 100.0 /100 | #23 | Exceptional 97.4% |
| Welsh | 100.0 /100 | #24 | Exceptional 97.4% |
| French | 100.0 /100 | #25 | Exceptional 97.4% |
| Scotch-Irish | 100.0 /100 | #26 | Exceptional 97.4% |
| Danes | 100.0 /100 | #27 | Exceptional 97.4% |
| Sioux | 100.0 /100 | #28 | Exceptional 97.4% |
| Scandinavians | 100.0 /100 | #29 | Exceptional 97.4% |
| Czechs | 100.0 /100 | #30 | Exceptional 97.4% |
| Europeans | 100.0 /100 | #31 | Exceptional 97.3% |
| Italians | 100.0 /100 | #32 | Exceptional 97.3% |
| Chippewa | 100.0 /100 | #33 | Exceptional 97.3% |
| Alaska Natives | 100.0 /100 | #34 | Exceptional 97.3% |
Demographics Similar to Immigrants from Malaysia by 7th Grade
In terms of 7th grade, the demographic groups most similar to Immigrants from Malaysia are Immigrants from Syria (95.7%, a difference of 0.010%), Immigrants from Oceania (95.7%, a difference of 0.010%), Immigrants from Eastern Asia (95.6%, a difference of 0.010%), Subsaharan African (95.7%, a difference of 0.020%), and Samoan (95.7%, a difference of 0.020%).
| Demographics | Rating | Rank | 7th Grade |
| Immigrants | Liberia | 8.1 /100 | #218 | Tragic 95.7% |
| Immigrants | Southern Europe | 7.9 /100 | #219 | Tragic 95.7% |
| Sub-Saharan Africans | 7.2 /100 | #220 | Tragic 95.7% |
| Samoans | 7.0 /100 | #221 | Tragic 95.7% |
| Laotians | 6.8 /100 | #222 | Tragic 95.7% |
| Immigrants | Syria | 6.7 /100 | #223 | Tragic 95.7% |
| Immigrants | Oceania | 6.7 /100 | #224 | Tragic 95.7% |
| Immigrants | Malaysia | 6.2 /100 | #225 | Tragic 95.6% |
| Immigrants | Eastern Asia | 5.8 /100 | #226 | Tragic 95.6% |
| Immigrants | Western Asia | 5.4 /100 | #227 | Tragic 95.6% |
| Immigrants | Eastern Africa | 5.1 /100 | #228 | Tragic 95.6% |
| Immigrants | Panama | 4.9 /100 | #229 | Tragic 95.6% |
| Natives/Alaskans | 4.2 /100 | #230 | Tragic 95.6% |
| Senegalese | 4.0 /100 | #231 | Tragic 95.6% |
| Costa Ricans | 3.3 /100 | #232 | Tragic 95.5% |