Danish vs Immigrants from Norway 3rd Grade
COMPARE
Danish
Immigrants from Norway
3rd Grade
3rd Grade Comparison
Danes
Immigrants from Norway
98.5%
3RD GRADE
100.0/ 100
METRIC RATING
24th/ 347
METRIC RANK
98.0%
3RD GRADE
95.2/ 100
METRIC RATING
116th/ 347
METRIC RANK
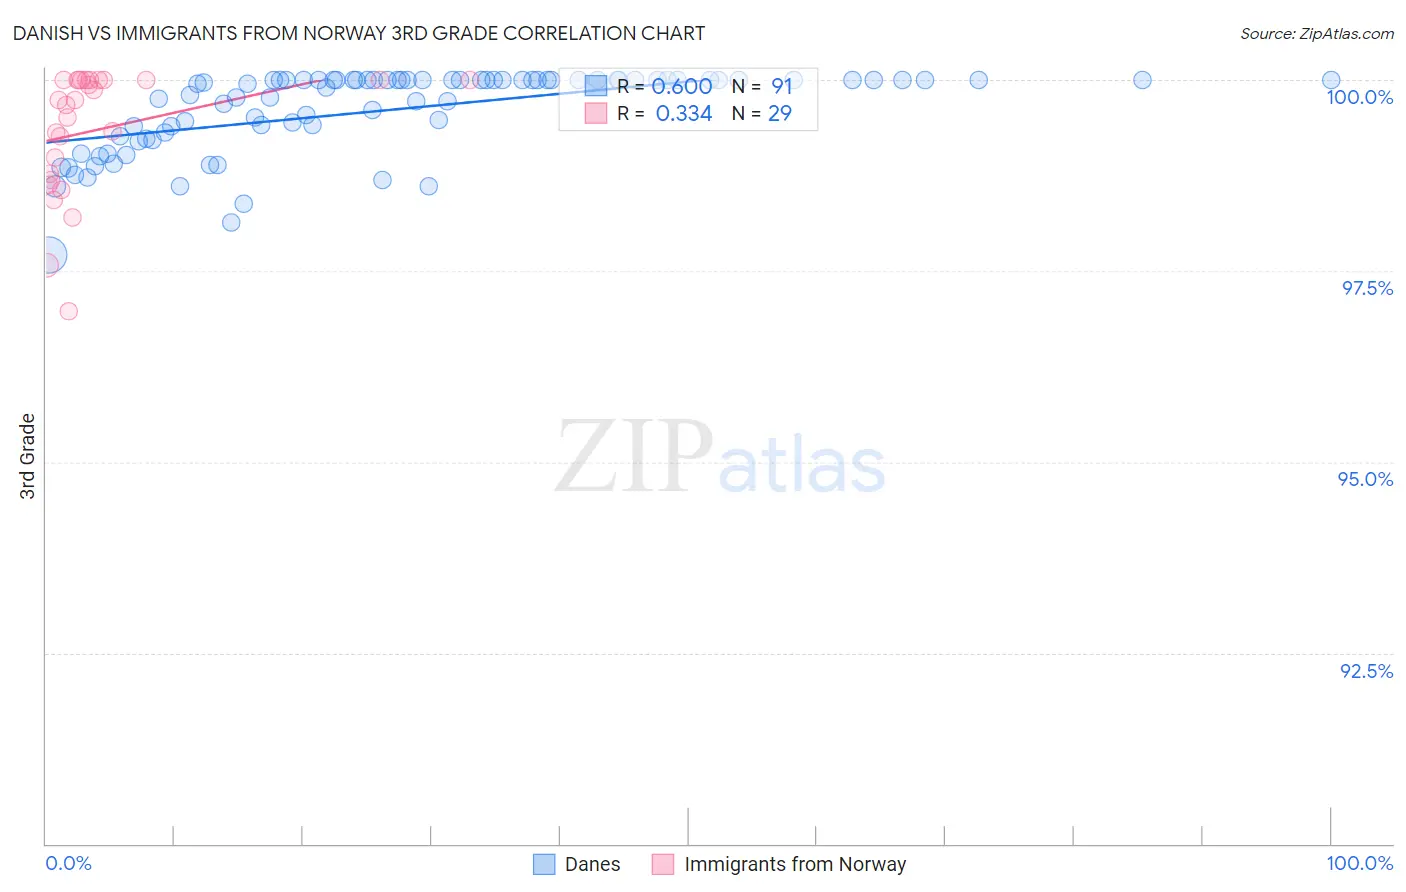
Danish vs Immigrants from Norway 3rd Grade Correlation Chart
The statistical analysis conducted on geographies consisting of 474,193,610 people shows a significant positive correlation between the proportion of Danes and percentage of population with at least 3rd grade education in the United States with a correlation coefficient (R) of 0.600 and weighted average of 98.5%. Similarly, the statistical analysis conducted on geographies consisting of 116,716,420 people shows a mild positive correlation between the proportion of Immigrants from Norway and percentage of population with at least 3rd grade education in the United States with a correlation coefficient (R) of 0.334 and weighted average of 98.0%, a difference of 0.48%.
3rd Grade Correlation Summary
| Measurement | Danish | Immigrants from Norway |
| Minimum | 97.7% | 97.0% |
| Maximum | 100.0% | 100.0% |
| Range | 2.3% | 3.0% |
| Mean | 99.6% | 99.4% |
| Median | 100.0% | 99.7% |
| Interquartile 25% (IQ1) | 99.3% | 98.7% |
| Interquartile 75% (IQ3) | 100.0% | 100.0% |
| Interquartile Range (IQR) | 0.74% | 1.3% |
| Standard Deviation (Sample) | 0.54% | 0.82% |
| Standard Deviation (Population) | 0.53% | 0.80% |
Similar Demographics by 3rd Grade
Demographics Similar to Danes by 3rd Grade
In terms of 3rd grade, the demographic groups most similar to Danes are Scotch-Irish (98.5%, a difference of 0.0%), Lithuanian (98.5%, a difference of 0.010%), Finnish (98.5%, a difference of 0.010%), Sioux (98.5%, a difference of 0.010%), and Aleut (98.5%, a difference of 0.010%).
| Demographics | Rating | Rank | 3rd Grade |
| Dutch | 100.0 /100 | #17 | Exceptional 98.5% |
| Irish | 100.0 /100 | #18 | Exceptional 98.5% |
| Poles | 100.0 /100 | #19 | Exceptional 98.5% |
| Pennsylvania Germans | 100.0 /100 | #20 | Exceptional 98.5% |
| Lithuanians | 100.0 /100 | #21 | Exceptional 98.5% |
| Finns | 100.0 /100 | #22 | Exceptional 98.5% |
| Sioux | 100.0 /100 | #23 | Exceptional 98.5% |
| Danes | 100.0 /100 | #24 | Exceptional 98.5% |
| Scotch-Irish | 100.0 /100 | #25 | Exceptional 98.5% |
| Aleuts | 100.0 /100 | #26 | Exceptional 98.5% |
| Croatians | 100.0 /100 | #27 | Exceptional 98.5% |
| French | 100.0 /100 | #28 | Exceptional 98.4% |
| French Canadians | 100.0 /100 | #29 | Exceptional 98.4% |
| Europeans | 100.0 /100 | #30 | Exceptional 98.4% |
| Czechs | 100.0 /100 | #31 | Exceptional 98.4% |
Demographics Similar to Immigrants from Norway by 3rd Grade
In terms of 3rd grade, the demographic groups most similar to Immigrants from Norway are Menominee (98.0%, a difference of 0.0%), Okinawan (98.0%, a difference of 0.0%), Immigrants from France (98.0%, a difference of 0.0%), Iranian (98.0%, a difference of 0.0%), and Thai (98.0%, a difference of 0.010%).
| Demographics | Rating | Rank | 3rd Grade |
| Pima | 96.7 /100 | #109 | Exceptional 98.0% |
| Immigrants | Switzerland | 96.6 /100 | #110 | Exceptional 98.0% |
| Basques | 96.5 /100 | #111 | Exceptional 98.0% |
| Immigrants | Latvia | 96.0 /100 | #112 | Exceptional 98.0% |
| Thais | 95.5 /100 | #113 | Exceptional 98.0% |
| Menominee | 95.4 /100 | #114 | Exceptional 98.0% |
| Okinawans | 95.2 /100 | #115 | Exceptional 98.0% |
| Immigrants | Norway | 95.2 /100 | #116 | Exceptional 98.0% |
| Immigrants | France | 95.1 /100 | #117 | Exceptional 98.0% |
| Iranians | 94.9 /100 | #118 | Exceptional 98.0% |
| Spanish | 94.8 /100 | #119 | Exceptional 98.0% |
| Immigrants | Croatia | 94.4 /100 | #120 | Exceptional 98.0% |
| Iroquois | 94.1 /100 | #121 | Exceptional 98.0% |
| Lebanese | 94.1 /100 | #122 | Exceptional 98.0% |
| Syrians | 93.8 /100 | #123 | Exceptional 98.0% |