Czech vs Finnish 10th Grade
COMPARE
Czech
Finnish
10th Grade
10th Grade Comparison
Czechs
Finns
95.5%
10TH GRADE
100.0/ 100
METRIC RATING
23rd/ 347
METRIC RANK
95.8%
10TH GRADE
100.0/ 100
METRIC RATING
9th/ 347
METRIC RANK
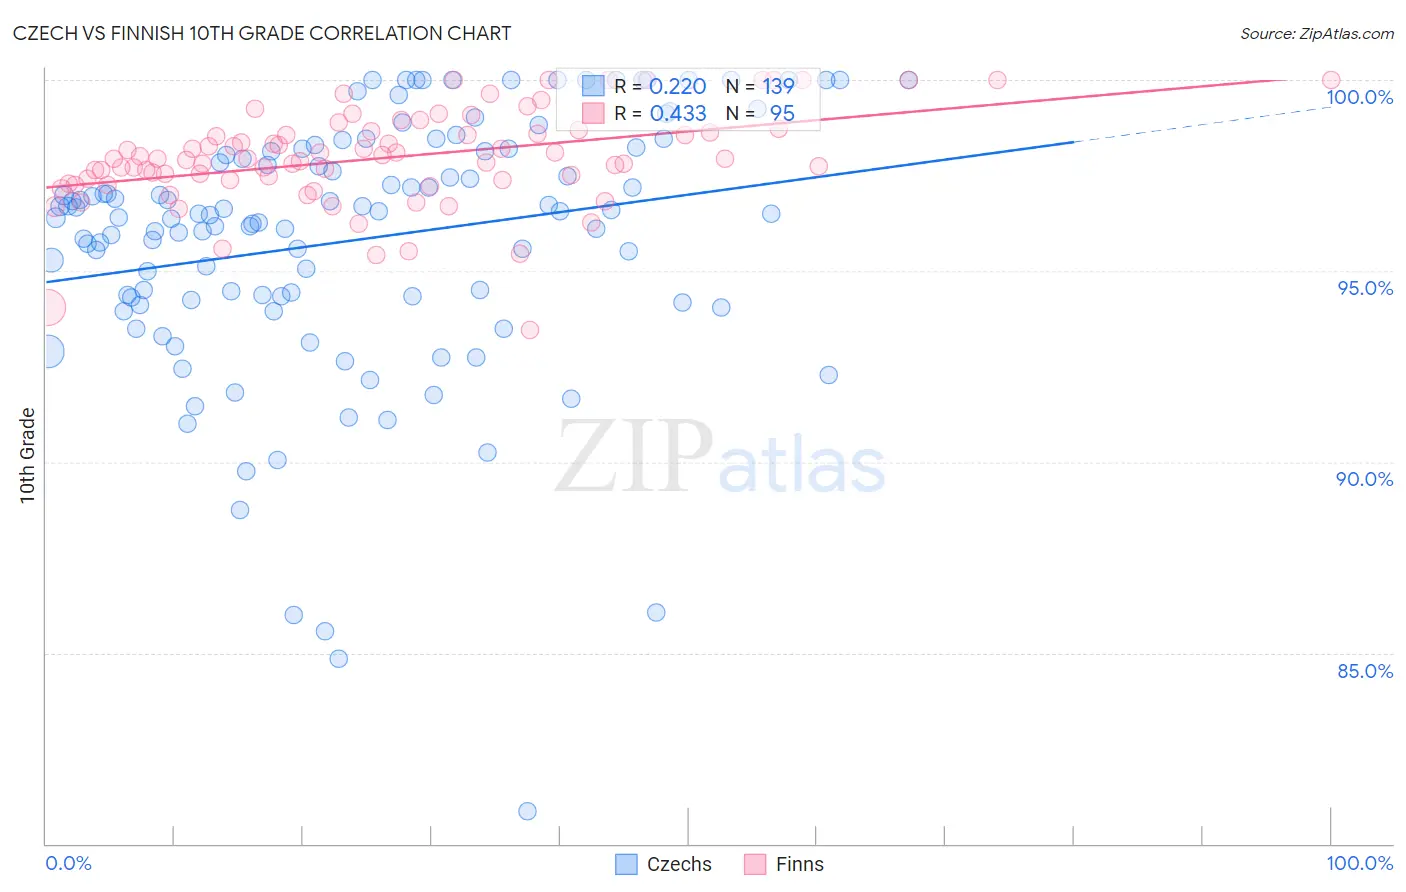
Czech vs Finnish 10th Grade Correlation Chart
The statistical analysis conducted on geographies consisting of 484,813,928 people shows a weak positive correlation between the proportion of Czechs and percentage of population with at least 10th grade education in the United States with a correlation coefficient (R) of 0.220 and weighted average of 95.5%. Similarly, the statistical analysis conducted on geographies consisting of 404,676,377 people shows a moderate positive correlation between the proportion of Finns and percentage of population with at least 10th grade education in the United States with a correlation coefficient (R) of 0.433 and weighted average of 95.8%, a difference of 0.28%.
10th Grade Correlation Summary
| Measurement | Czech | Finnish |
| Minimum | 80.9% | 93.5% |
| Maximum | 100.0% | 100.0% |
| Range | 19.1% | 6.5% |
| Mean | 95.8% | 98.0% |
| Median | 96.5% | 97.9% |
| Interquartile 25% (IQ1) | 94.3% | 97.4% |
| Interquartile 75% (IQ3) | 98.1% | 98.7% |
| Interquartile Range (IQR) | 3.9% | 1.3% |
| Standard Deviation (Sample) | 3.4% | 1.3% |
| Standard Deviation (Population) | 3.4% | 1.3% |
Demographics Similar to Czechs and Finns by 10th Grade
In terms of 10th grade, the demographic groups most similar to Czechs are Eastern European (95.5%, a difference of 0.010%), European (95.5%, a difference of 0.010%), Maltese (95.5%, a difference of 0.020%), Welsh (95.5%, a difference of 0.030%), and Dutch (95.5%, a difference of 0.050%). Similarly, the demographic groups most similar to Finns are Croatian (95.7%, a difference of 0.020%), Lithuanian (95.8%, a difference of 0.060%), Danish (95.7%, a difference of 0.060%), German (95.8%, a difference of 0.070%), and Polish (95.8%, a difference of 0.080%).
| Demographics | Rating | Rank | 10th Grade |
| Poles | 100.0 /100 | #6 | Exceptional 95.8% |
| Germans | 100.0 /100 | #7 | Exceptional 95.8% |
| Lithuanians | 100.0 /100 | #8 | Exceptional 95.8% |
| Finns | 100.0 /100 | #9 | Exceptional 95.8% |
| Croatians | 100.0 /100 | #10 | Exceptional 95.7% |
| Danes | 100.0 /100 | #11 | Exceptional 95.7% |
| Tlingit-Haida | 100.0 /100 | #12 | Exceptional 95.7% |
| English | 100.0 /100 | #13 | Exceptional 95.6% |
| Tsimshian | 100.0 /100 | #14 | Exceptional 95.6% |
| Irish | 100.0 /100 | #15 | Exceptional 95.6% |
| Scottish | 100.0 /100 | #16 | Exceptional 95.6% |
| Latvians | 100.0 /100 | #17 | Exceptional 95.6% |
| Italians | 100.0 /100 | #18 | Exceptional 95.6% |
| Scandinavians | 100.0 /100 | #19 | Exceptional 95.6% |
| Chinese | 100.0 /100 | #20 | Exceptional 95.5% |
| Dutch | 100.0 /100 | #21 | Exceptional 95.5% |
| Eastern Europeans | 100.0 /100 | #22 | Exceptional 95.5% |
| Czechs | 100.0 /100 | #23 | Exceptional 95.5% |
| Europeans | 100.0 /100 | #24 | Exceptional 95.5% |
| Maltese | 100.0 /100 | #25 | Exceptional 95.5% |
| Welsh | 100.0 /100 | #26 | Exceptional 95.5% |