Czech vs Immigrants from Australia Householder Income Under 25 years
COMPARE
Czech
Immigrants from Australia
Householder Income Under 25 years
Householder Income Under 25 years Comparison
Czechs
Immigrants from Australia
$51,421
HOUSEHOLDER INCOME UNDER 25 YEARS
13.2/ 100
METRIC RATING
204th/ 347
METRIC RANK
$56,660
HOUSEHOLDER INCOME UNDER 25 YEARS
100.0/ 100
METRIC RATING
26th/ 347
METRIC RANK
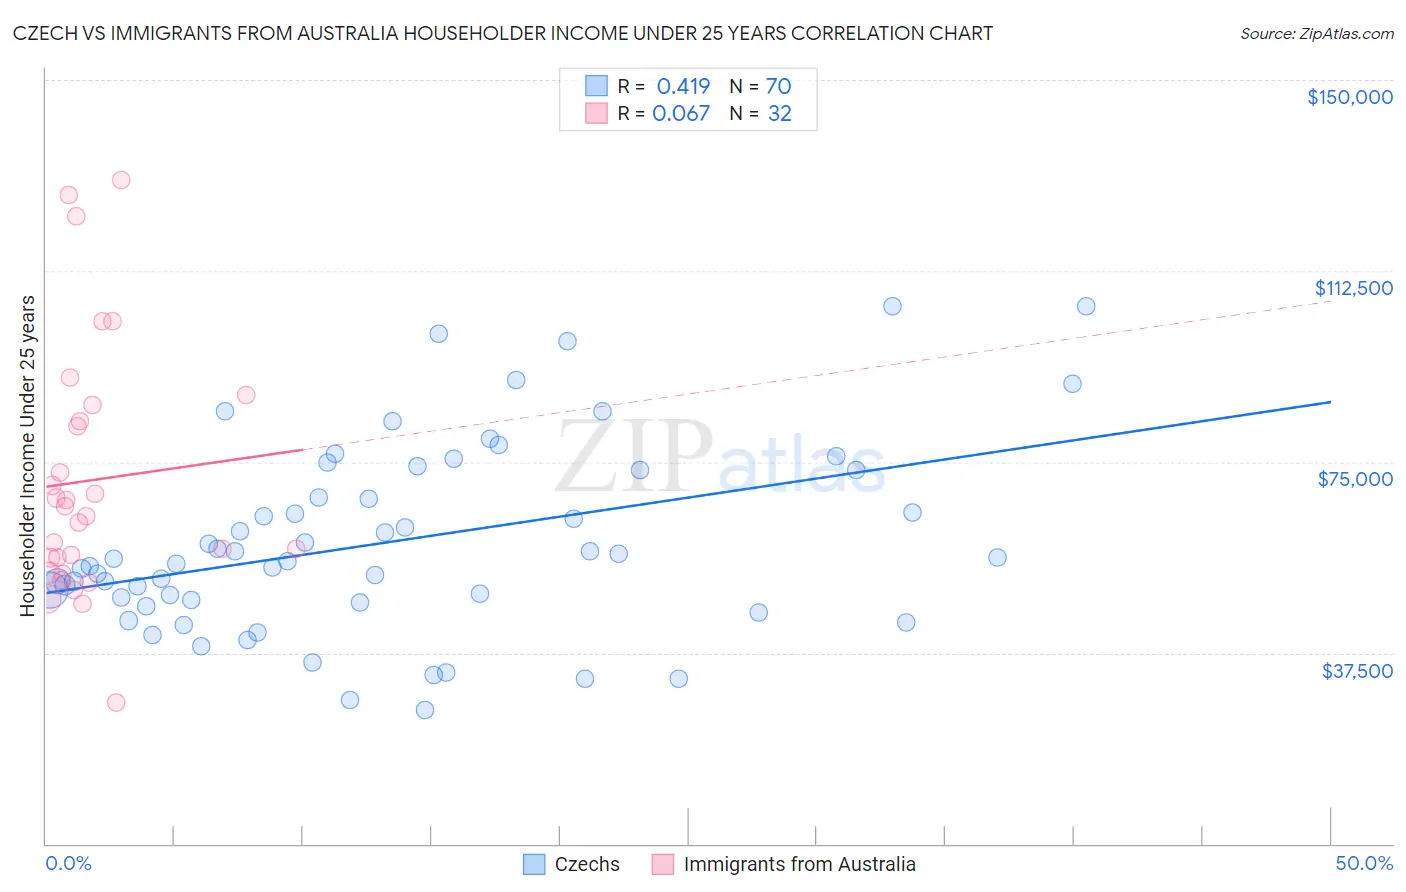
Czech vs Immigrants from Australia Householder Income Under 25 years Correlation Chart
The statistical analysis conducted on geographies consisting of 392,855,658 people shows a moderate positive correlation between the proportion of Czechs and household income with householder under the age of 25 in the United States with a correlation coefficient (R) of 0.419 and weighted average of $51,421. Similarly, the statistical analysis conducted on geographies consisting of 199,739,590 people shows a slight positive correlation between the proportion of Immigrants from Australia and household income with householder under the age of 25 in the United States with a correlation coefficient (R) of 0.067 and weighted average of $56,660, a difference of 10.2%.
Householder Income Under 25 years Correlation Summary
| Measurement | Czech | Immigrants from Australia |
| Minimum | $26,250 | $27,721 |
| Maximum | $105,500 | $130,352 |
| Range | $79,250 | $102,631 |
| Mean | $59,266 | $71,401 |
| Median | $55,643 | $65,194 |
| Interquartile 25% (IQ1) | $47,952 | $54,774 |
| Interquartile 75% (IQ3) | $73,438 | $84,560 |
| Interquartile Range (IQR) | $25,486 | $29,785 |
| Standard Deviation (Sample) | $18,394 | $24,568 |
| Standard Deviation (Population) | $18,262 | $24,181 |
Similar Demographics by Householder Income Under 25 years
Demographics Similar to Czechs by Householder Income Under 25 years
In terms of householder income under 25 years, the demographic groups most similar to Czechs are Immigrants from Cameroon ($51,433, a difference of 0.020%), Immigrants from Guatemala ($51,447, a difference of 0.050%), Cape Verdean ($51,387, a difference of 0.070%), Immigrants from Latin America ($51,387, a difference of 0.070%), and South African ($51,383, a difference of 0.070%).
| Demographics | Rating | Rank | Householder Income Under 25 years |
| Pima | 15.7 /100 | #197 | Poor $51,503 |
| Immigrants | Syria | 15.4 /100 | #198 | Poor $51,494 |
| Swiss | 15.4 /100 | #199 | Poor $51,493 |
| Immigrants | West Indies | 14.9 /100 | #200 | Poor $51,479 |
| British | 14.9 /100 | #201 | Poor $51,477 |
| Immigrants | Guatemala | 14.0 /100 | #202 | Poor $51,447 |
| Immigrants | Cameroon | 13.6 /100 | #203 | Poor $51,433 |
| Czechs | 13.2 /100 | #204 | Poor $51,421 |
| Cape Verdeans | 12.3 /100 | #205 | Poor $51,387 |
| Immigrants | Latin America | 12.3 /100 | #206 | Poor $51,387 |
| South Africans | 12.2 /100 | #207 | Poor $51,383 |
| Immigrants | Jordan | 11.9 /100 | #208 | Poor $51,370 |
| Syrians | 11.4 /100 | #209 | Poor $51,353 |
| Immigrants | Ghana | 10.9 /100 | #210 | Poor $51,333 |
| Irish | 10.6 /100 | #211 | Poor $51,317 |
Demographics Similar to Immigrants from Australia by Householder Income Under 25 years
In terms of householder income under 25 years, the demographic groups most similar to Immigrants from Australia are Immigrants from Pakistan ($56,789, a difference of 0.23%), Immigrants from North Macedonia ($56,503, a difference of 0.28%), Immigrants from Singapore ($56,835, a difference of 0.31%), Immigrants from Peru ($56,384, a difference of 0.49%), and Immigrants from Asia ($56,379, a difference of 0.50%).
| Demographics | Rating | Rank | Householder Income Under 25 years |
| Bhutanese | 100.0 /100 | #19 | Exceptional $57,078 |
| Immigrants | Ireland | 100.0 /100 | #20 | Exceptional $57,075 |
| Immigrants | Fiji | 100.0 /100 | #21 | Exceptional $57,074 |
| Asians | 100.0 /100 | #22 | Exceptional $57,003 |
| Tongans | 100.0 /100 | #23 | Exceptional $56,972 |
| Immigrants | Singapore | 100.0 /100 | #24 | Exceptional $56,835 |
| Immigrants | Pakistan | 100.0 /100 | #25 | Exceptional $56,789 |
| Immigrants | Australia | 100.0 /100 | #26 | Exceptional $56,660 |
| Immigrants | North Macedonia | 100.0 /100 | #27 | Exceptional $56,503 |
| Immigrants | Peru | 100.0 /100 | #28 | Exceptional $56,384 |
| Immigrants | Asia | 100.0 /100 | #29 | Exceptional $56,379 |
| Immigrants | Moldova | 100.0 /100 | #30 | Exceptional $56,168 |
| Vietnamese | 100.0 /100 | #31 | Exceptional $56,127 |
| Peruvians | 100.0 /100 | #32 | Exceptional $56,052 |
| Inupiat | 100.0 /100 | #33 | Exceptional $55,935 |