Czech vs British West Indian Doctorate Degree
COMPARE
Czech
British West Indian
Doctorate Degree
Doctorate Degree Comparison
Czechs
British West Indians
1.9%
DOCTORATE DEGREE
67.3/ 100
METRIC RATING
163rd/ 347
METRIC RANK
1.5%
DOCTORATE DEGREE
0.3/ 100
METRIC RATING
282nd/ 347
METRIC RANK
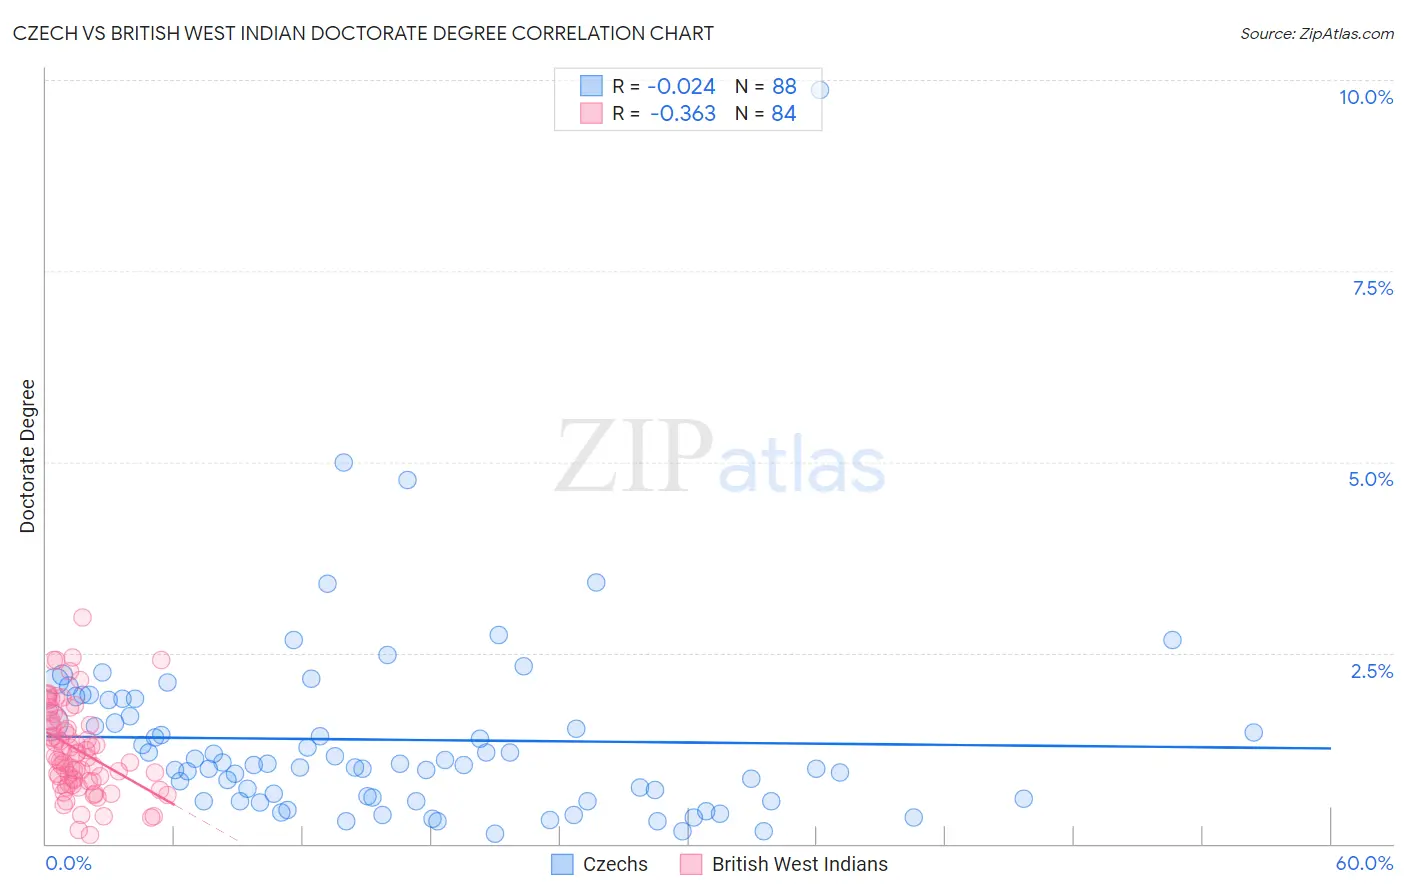
Czech vs British West Indian Doctorate Degree Correlation Chart
The statistical analysis conducted on geographies consisting of 474,197,515 people shows no correlation between the proportion of Czechs and percentage of population with at least doctorate degree education in the United States with a correlation coefficient (R) of -0.024 and weighted average of 1.9%. Similarly, the statistical analysis conducted on geographies consisting of 152,241,943 people shows a mild negative correlation between the proportion of British West Indians and percentage of population with at least doctorate degree education in the United States with a correlation coefficient (R) of -0.363 and weighted average of 1.5%, a difference of 29.5%.
Doctorate Degree Correlation Summary
| Measurement | Czech | British West Indian |
| Minimum | 0.13% | 0.12% |
| Maximum | 9.9% | 3.0% |
| Range | 9.7% | 2.8% |
| Mean | 1.4% | 1.2% |
| Median | 1.0% | 1.1% |
| Interquartile 25% (IQ1) | 0.58% | 0.82% |
| Interquartile 75% (IQ3) | 1.8% | 1.6% |
| Interquartile Range (IQR) | 1.2% | 0.79% |
| Standard Deviation (Sample) | 1.3% | 0.58% |
| Standard Deviation (Population) | 1.3% | 0.58% |
Similar Demographics by Doctorate Degree
Demographics Similar to Czechs by Doctorate Degree
In terms of doctorate degree, the demographic groups most similar to Czechs are Irish (1.9%, a difference of 0.040%), Celtic (1.9%, a difference of 0.10%), Immigrants from Middle Africa (1.9%, a difference of 0.25%), Welsh (1.9%, a difference of 0.40%), and Slovene (1.9%, a difference of 0.49%).
| Demographics | Rating | Rank | Doctorate Degree |
| Slavs | 72.4 /100 | #156 | Good 1.9% |
| Danes | 71.9 /100 | #157 | Good 1.9% |
| Hungarians | 71.7 /100 | #158 | Good 1.9% |
| Slovenes | 70.2 /100 | #159 | Good 1.9% |
| Welsh | 69.7 /100 | #160 | Good 1.9% |
| Immigrants | Middle Africa | 68.8 /100 | #161 | Good 1.9% |
| Irish | 67.5 /100 | #162 | Good 1.9% |
| Czechs | 67.3 /100 | #163 | Good 1.9% |
| Celtics | 66.7 /100 | #164 | Good 1.9% |
| Scotch-Irish | 63.6 /100 | #165 | Good 1.9% |
| Spaniards | 63.5 /100 | #166 | Good 1.9% |
| Macedonians | 60.9 /100 | #167 | Good 1.9% |
| Sri Lankans | 60.3 /100 | #168 | Good 1.9% |
| Vietnamese | 54.8 /100 | #169 | Average 1.9% |
| Costa Ricans | 53.3 /100 | #170 | Average 1.8% |
Demographics Similar to British West Indians by Doctorate Degree
In terms of doctorate degree, the demographic groups most similar to British West Indians are Tohono O'odham (1.5%, a difference of 0.050%), Central American (1.5%, a difference of 0.050%), Jamaican (1.5%, a difference of 0.090%), Malaysian (1.5%, a difference of 0.11%), and Ecuadorian (1.5%, a difference of 0.12%).
| Demographics | Rating | Rank | Doctorate Degree |
| Aleuts | 0.4 /100 | #275 | Tragic 1.5% |
| Paiute | 0.4 /100 | #276 | Tragic 1.5% |
| Bahamians | 0.4 /100 | #277 | Tragic 1.5% |
| Hawaiians | 0.4 /100 | #278 | Tragic 1.5% |
| Marshallese | 0.4 /100 | #279 | Tragic 1.5% |
| Ecuadorians | 0.4 /100 | #280 | Tragic 1.5% |
| Tohono O'odham | 0.4 /100 | #281 | Tragic 1.5% |
| British West Indians | 0.3 /100 | #282 | Tragic 1.5% |
| Central Americans | 0.3 /100 | #283 | Tragic 1.5% |
| Jamaicans | 0.3 /100 | #284 | Tragic 1.5% |
| Malaysians | 0.3 /100 | #285 | Tragic 1.5% |
| Cherokee | 0.3 /100 | #286 | Tragic 1.5% |
| Cajuns | 0.3 /100 | #287 | Tragic 1.5% |
| Immigrants | El Salvador | 0.3 /100 | #288 | Tragic 1.4% |
| Cape Verdeans | 0.3 /100 | #289 | Tragic 1.4% |