Czech vs Immigrants from Guyana Master's Degree
COMPARE
Czech
Immigrants from Guyana
Master's Degree
Master's Degree Comparison
Czechs
Immigrants from Guyana
14.7%
MASTER'S DEGREE
40.4/ 100
METRIC RATING
182nd/ 347
METRIC RANK
13.4%
MASTER'S DEGREE
4.4/ 100
METRIC RATING
236th/ 347
METRIC RANK
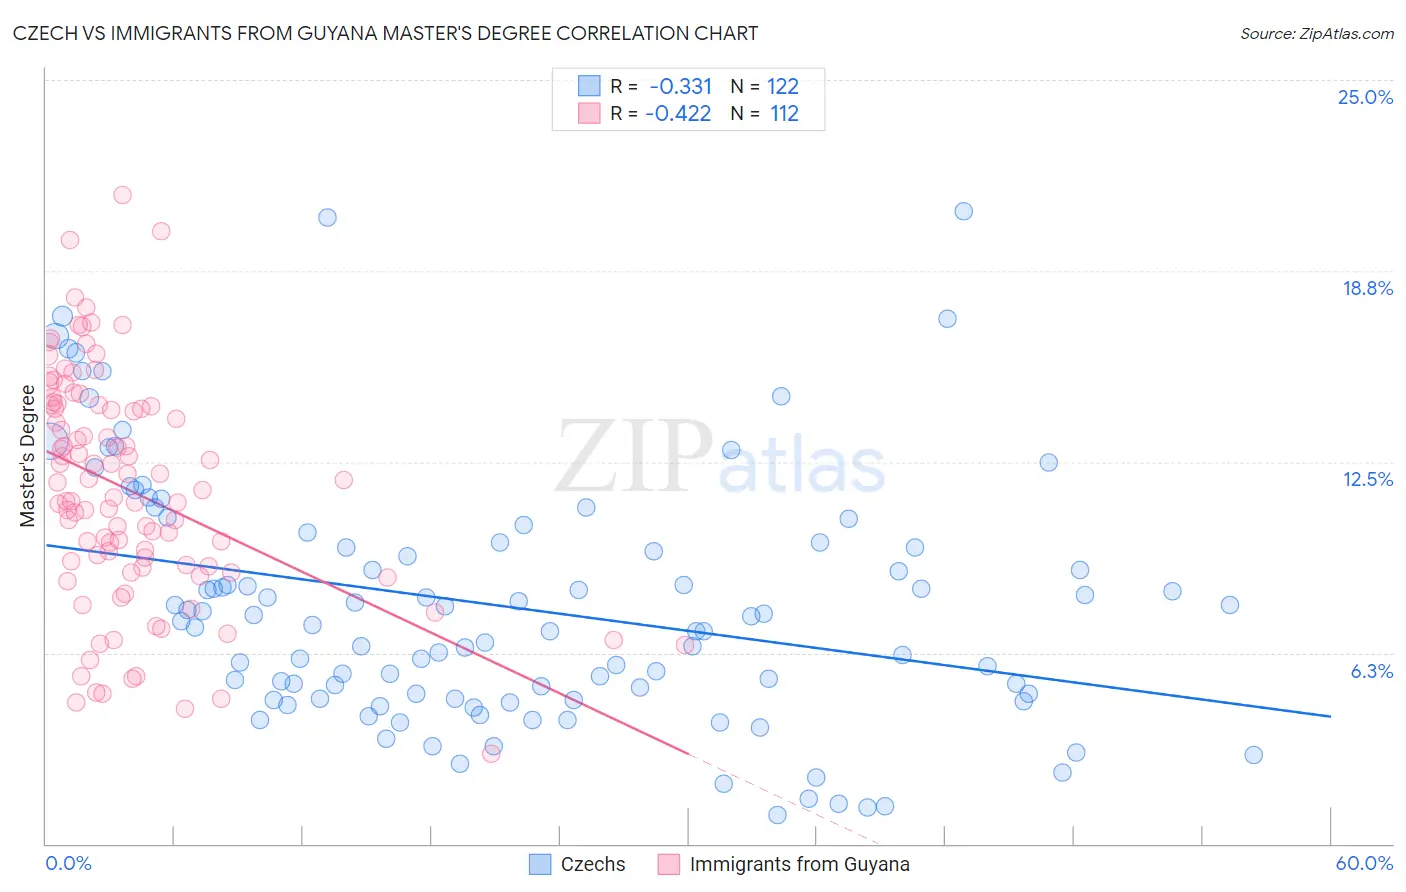
Czech vs Immigrants from Guyana Master's Degree Correlation Chart
The statistical analysis conducted on geographies consisting of 484,547,071 people shows a mild negative correlation between the proportion of Czechs and percentage of population with at least master's degree education in the United States with a correlation coefficient (R) of -0.331 and weighted average of 14.7%. Similarly, the statistical analysis conducted on geographies consisting of 183,731,921 people shows a moderate negative correlation between the proportion of Immigrants from Guyana and percentage of population with at least master's degree education in the United States with a correlation coefficient (R) of -0.422 and weighted average of 13.4%, a difference of 9.6%.
Master's Degree Correlation Summary
| Measurement | Czech | Immigrants from Guyana |
| Minimum | 0.93% | 3.0% |
| Maximum | 20.7% | 21.2% |
| Range | 19.8% | 18.3% |
| Mean | 7.8% | 11.6% |
| Median | 7.2% | 11.5% |
| Interquartile 25% (IQ1) | 4.7% | 9.1% |
| Interquartile 75% (IQ3) | 9.9% | 14.3% |
| Interquartile Range (IQR) | 5.1% | 5.3% |
| Standard Deviation (Sample) | 4.1% | 3.7% |
| Standard Deviation (Population) | 4.1% | 3.7% |
Similar Demographics by Master's Degree
Demographics Similar to Czechs by Master's Degree
In terms of master's degree, the demographic groups most similar to Czechs are Swiss (14.7%, a difference of 0.10%), Sri Lankan (14.7%, a difference of 0.10%), Celtic (14.8%, a difference of 0.12%), Immigrants from Zaire (14.7%, a difference of 0.12%), and Immigrants from Iraq (14.8%, a difference of 0.13%).
| Demographics | Rating | Rank | Master's Degree |
| Immigrants | Peru | 49.6 /100 | #175 | Average 14.9% |
| Nigerians | 48.6 /100 | #176 | Average 14.9% |
| Immigrants | Colombia | 48.3 /100 | #177 | Average 14.9% |
| English | 45.0 /100 | #178 | Average 14.8% |
| Immigrants | Iraq | 41.3 /100 | #179 | Average 14.8% |
| Celtics | 41.3 /100 | #180 | Average 14.8% |
| Swiss | 41.1 /100 | #181 | Average 14.7% |
| Czechs | 40.4 /100 | #182 | Average 14.7% |
| Sri Lankans | 39.6 /100 | #183 | Fair 14.7% |
| Immigrants | Zaire | 39.5 /100 | #184 | Fair 14.7% |
| Barbadians | 38.3 /100 | #185 | Fair 14.7% |
| Immigrants | Oceania | 37.1 /100 | #186 | Fair 14.7% |
| Basques | 36.5 /100 | #187 | Fair 14.7% |
| Immigrants | Costa Rica | 36.2 /100 | #188 | Fair 14.7% |
| Immigrants | Immigrants | 36.0 /100 | #189 | Fair 14.6% |
Demographics Similar to Immigrants from Guyana by Master's Degree
In terms of master's degree, the demographic groups most similar to Immigrants from Guyana are German Russian (13.5%, a difference of 0.11%), Jamaican (13.4%, a difference of 0.22%), Hmong (13.4%, a difference of 0.36%), Immigrants from Burma/Myanmar (13.5%, a difference of 0.52%), and Nonimmigrants (13.3%, a difference of 0.89%).
| Demographics | Rating | Rank | Master's Degree |
| British West Indians | 8.8 /100 | #229 | Tragic 13.8% |
| Dutch | 8.7 /100 | #230 | Tragic 13.8% |
| Guyanese | 7.6 /100 | #231 | Tragic 13.7% |
| Immigrants | Philippines | 6.0 /100 | #232 | Tragic 13.6% |
| Immigrants | Ecuador | 5.7 /100 | #233 | Tragic 13.6% |
| Immigrants | Burma/Myanmar | 5.0 /100 | #234 | Tragic 13.5% |
| German Russians | 4.5 /100 | #235 | Tragic 13.5% |
| Immigrants | Guyana | 4.4 /100 | #236 | Tragic 13.4% |
| Jamaicans | 4.1 /100 | #237 | Tragic 13.4% |
| Hmong | 4.0 /100 | #238 | Tragic 13.4% |
| Immigrants | Nonimmigrants | 3.4 /100 | #239 | Tragic 13.3% |
| Guamanians/Chamorros | 2.2 /100 | #240 | Tragic 13.1% |
| U.S. Virgin Islanders | 2.1 /100 | #241 | Tragic 13.1% |
| Spanish Americans | 1.9 /100 | #242 | Tragic 13.0% |
| Immigrants | Jamaica | 1.9 /100 | #243 | Tragic 13.0% |