Colombian vs Indonesian Associate's Degree
COMPARE
Colombian
Indonesian
Associate's Degree
Associate's Degree Comparison
Colombians
Indonesians
46.8%
ASSOCIATE'S DEGREE
62.4/ 100
METRIC RATING
164th/ 347
METRIC RANK
41.9%
ASSOCIATE'S DEGREE
0.6/ 100
METRIC RATING
253rd/ 347
METRIC RANK
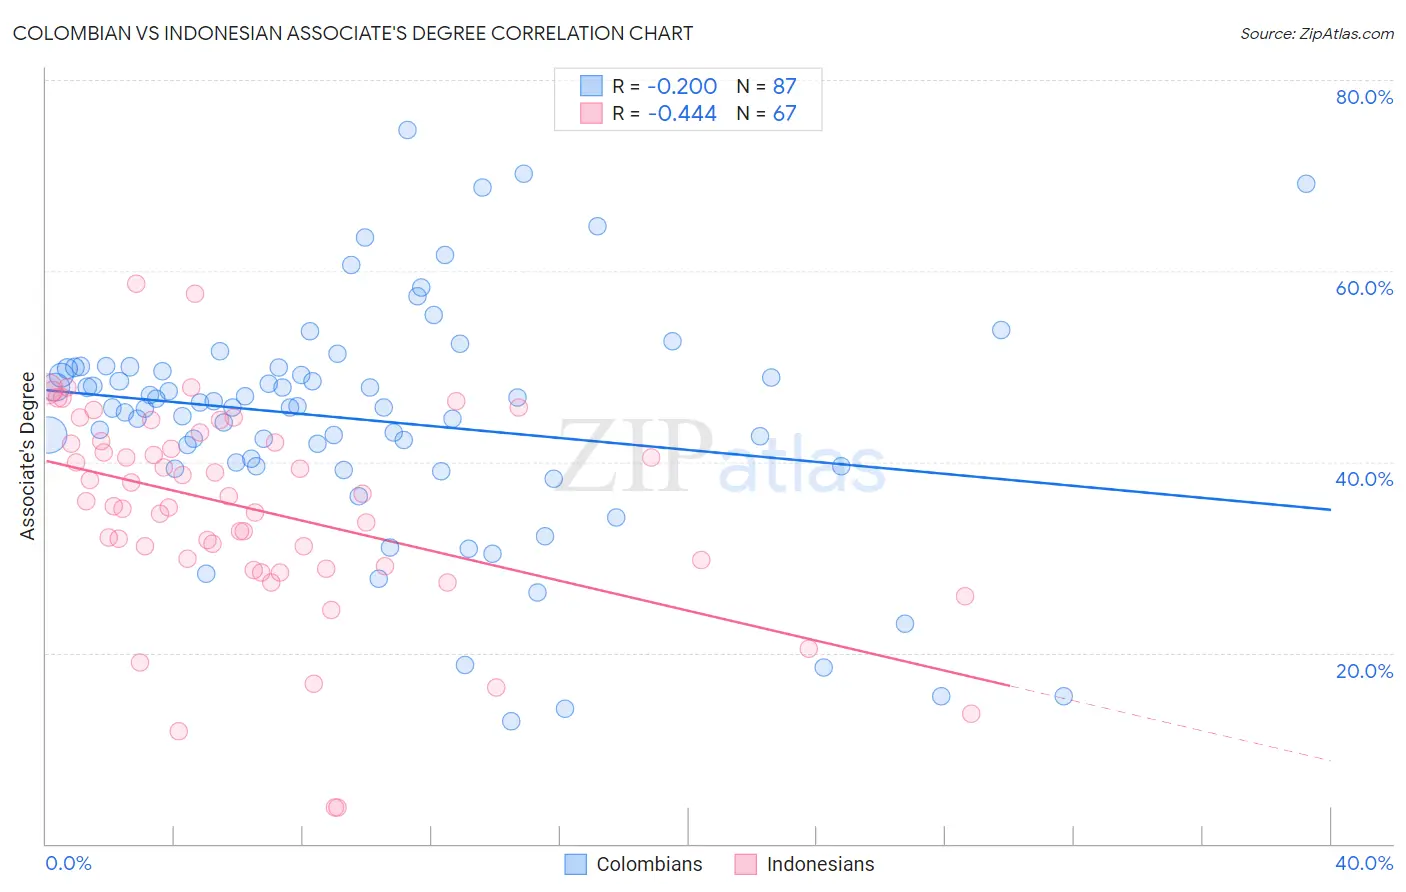
Colombian vs Indonesian Associate's Degree Correlation Chart
The statistical analysis conducted on geographies consisting of 419,659,293 people shows a weak negative correlation between the proportion of Colombians and percentage of population with at least associate's degree education in the United States with a correlation coefficient (R) of -0.200 and weighted average of 46.8%. Similarly, the statistical analysis conducted on geographies consisting of 162,722,822 people shows a moderate negative correlation between the proportion of Indonesians and percentage of population with at least associate's degree education in the United States with a correlation coefficient (R) of -0.444 and weighted average of 41.9%, a difference of 11.7%.
Associate's Degree Correlation Summary
| Measurement | Colombian | Indonesian |
| Minimum | 12.8% | 3.8% |
| Maximum | 74.8% | 58.7% |
| Range | 62.0% | 54.9% |
| Mean | 44.4% | 35.0% |
| Median | 45.7% | 35.9% |
| Interquartile 25% (IQ1) | 39.6% | 29.0% |
| Interquartile 75% (IQ3) | 49.8% | 42.1% |
| Interquartile Range (IQR) | 10.3% | 13.1% |
| Standard Deviation (Sample) | 12.2% | 11.0% |
| Standard Deviation (Population) | 12.1% | 10.9% |
Similar Demographics by Associate's Degree
Demographics Similar to Colombians by Associate's Degree
In terms of associate's degree, the demographic groups most similar to Colombians are Somali (46.8%, a difference of 0.010%), Immigrants from Africa (46.8%, a difference of 0.060%), Immigrants from South America (46.7%, a difference of 0.20%), Scandinavian (46.9%, a difference of 0.23%), and Scottish (46.9%, a difference of 0.24%).
| Demographics | Rating | Rank | Associate's Degree |
| Sudanese | 70.3 /100 | #157 | Good 47.1% |
| Immigrants | Germany | 69.7 /100 | #158 | Good 47.1% |
| Immigrants | Poland | 69.2 /100 | #159 | Good 47.1% |
| Scottish | 65.4 /100 | #160 | Good 46.9% |
| Scandinavians | 65.2 /100 | #161 | Good 46.9% |
| Immigrants | Africa | 63.2 /100 | #162 | Good 46.8% |
| Somalis | 62.5 /100 | #163 | Good 46.8% |
| Colombians | 62.4 /100 | #164 | Good 46.8% |
| Immigrants | South America | 59.9 /100 | #165 | Average 46.7% |
| Hungarians | 59.3 /100 | #166 | Average 46.7% |
| Immigrants | Sierra Leone | 59.2 /100 | #167 | Average 46.7% |
| Immigrants | Somalia | 55.5 /100 | #168 | Average 46.5% |
| Uruguayans | 55.4 /100 | #169 | Average 46.5% |
| Irish | 53.6 /100 | #170 | Average 46.5% |
| Basques | 52.8 /100 | #171 | Average 46.5% |
Demographics Similar to Indonesians by Associate's Degree
In terms of associate's degree, the demographic groups most similar to Indonesians are Cuban (41.9%, a difference of 0.060%), French American Indian (42.0%, a difference of 0.10%), Immigrants from Guyana (41.8%, a difference of 0.15%), Immigrants from Congo (41.8%, a difference of 0.28%), and Spanish American (41.8%, a difference of 0.34%).
| Demographics | Rating | Rank | Associate's Degree |
| Delaware | 0.9 /100 | #246 | Tragic 42.3% |
| Immigrants | Fiji | 0.8 /100 | #247 | Tragic 42.2% |
| Immigrants | Ecuador | 0.8 /100 | #248 | Tragic 42.2% |
| Jamaicans | 0.7 /100 | #249 | Tragic 42.1% |
| U.S. Virgin Islanders | 0.7 /100 | #250 | Tragic 42.1% |
| Immigrants | Bahamas | 0.7 /100 | #251 | Tragic 42.1% |
| French American Indians | 0.6 /100 | #252 | Tragic 42.0% |
| Indonesians | 0.6 /100 | #253 | Tragic 41.9% |
| Cubans | 0.6 /100 | #254 | Tragic 41.9% |
| Immigrants | Guyana | 0.5 /100 | #255 | Tragic 41.8% |
| Immigrants | Congo | 0.5 /100 | #256 | Tragic 41.8% |
| Spanish Americans | 0.5 /100 | #257 | Tragic 41.8% |
| Japanese | 0.5 /100 | #258 | Tragic 41.7% |
| Malaysians | 0.4 /100 | #259 | Tragic 41.6% |
| Marshallese | 0.4 /100 | #260 | Tragic 41.6% |