Czechoslovakian vs Immigrants from Nepal Single Father Households
COMPARE
Czechoslovakian
Immigrants from Nepal
Single Father Households
Single Father Households Comparison
Czechoslovakians
Immigrants from Nepal
2.3%
SINGLE FATHER HOUSEHOLDS
58.9/ 100
METRIC RATING
172nd/ 347
METRIC RANK
2.2%
SINGLE FATHER HOUSEHOLDS
92.1/ 100
METRIC RATING
143rd/ 347
METRIC RANK
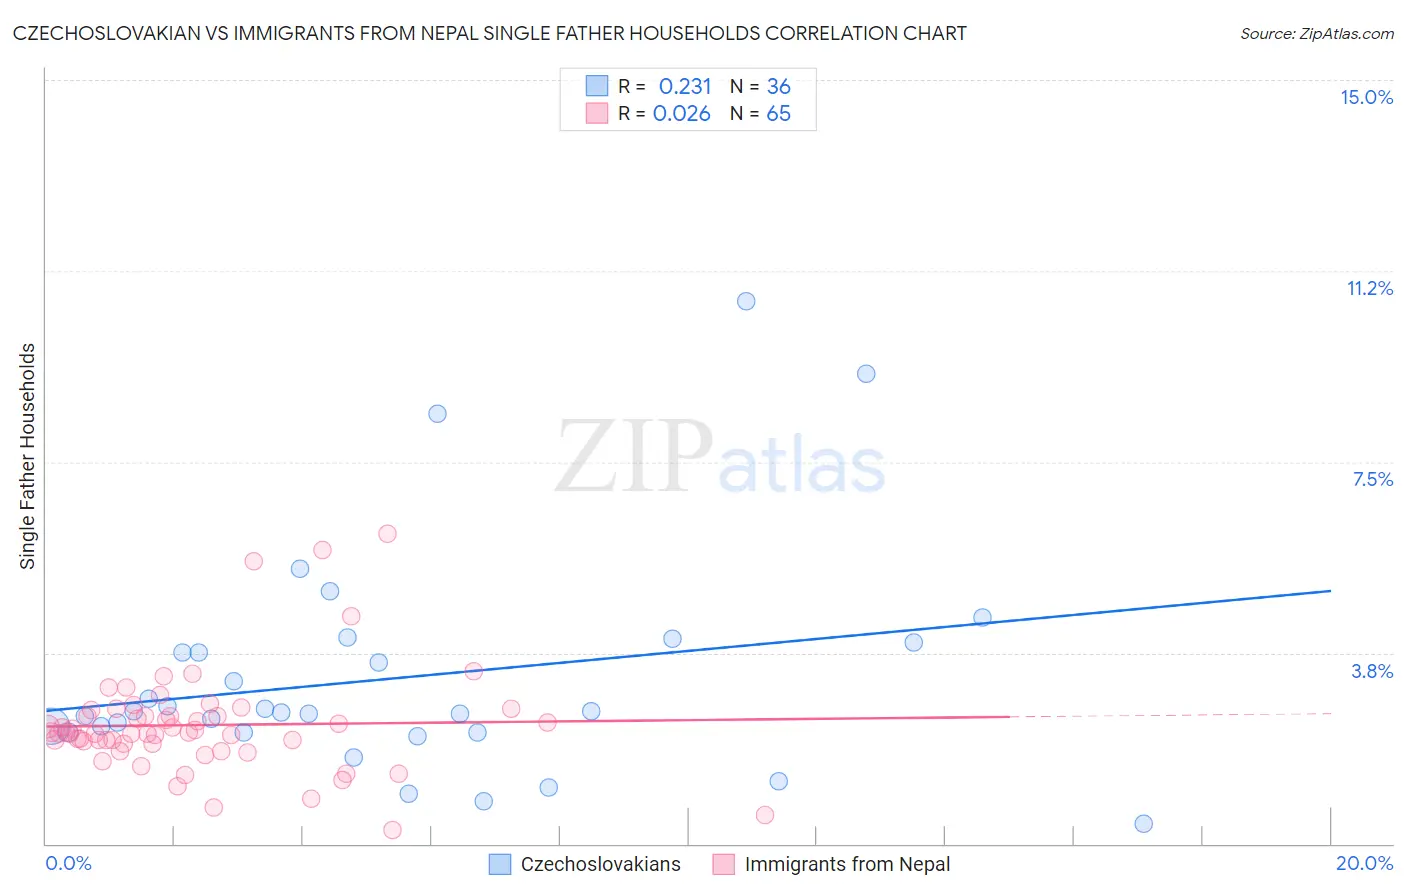
Czechoslovakian vs Immigrants from Nepal Single Father Households Correlation Chart
The statistical analysis conducted on geographies consisting of 365,345,214 people shows a weak positive correlation between the proportion of Czechoslovakians and percentage of single father households in the United States with a correlation coefficient (R) of 0.231 and weighted average of 2.3%. Similarly, the statistical analysis conducted on geographies consisting of 186,164,733 people shows no correlation between the proportion of Immigrants from Nepal and percentage of single father households in the United States with a correlation coefficient (R) of 0.026 and weighted average of 2.2%, a difference of 4.0%.
Single Father Households Correlation Summary
| Measurement | Czechoslovakian | Immigrants from Nepal |
| Minimum | 0.39% | 0.28% |
| Maximum | 10.7% | 6.1% |
| Range | 10.3% | 5.8% |
| Mean | 3.3% | 2.3% |
| Median | 2.6% | 2.2% |
| Interquartile 25% (IQ1) | 2.2% | 2.0% |
| Interquartile 75% (IQ3) | 3.9% | 2.6% |
| Interquartile Range (IQR) | 1.7% | 0.61% |
| Standard Deviation (Sample) | 2.2% | 1.0% |
| Standard Deviation (Population) | 2.2% | 1.0% |
Similar Demographics by Single Father Households
Demographics Similar to Czechoslovakians by Single Father Households
In terms of single father households, the demographic groups most similar to Czechoslovakians are Swedish (2.3%, a difference of 0.21%), Ugandan (2.3%, a difference of 0.26%), Celtic (2.3%, a difference of 0.26%), Czech (2.3%, a difference of 0.29%), and Icelander (2.3%, a difference of 0.33%).
| Demographics | Rating | Rank | Single Father Households |
| Scotch-Irish | 69.4 /100 | #165 | Good 2.3% |
| English | 68.6 /100 | #166 | Good 2.3% |
| South Americans | 64.3 /100 | #167 | Good 2.3% |
| Icelanders | 63.1 /100 | #168 | Good 2.3% |
| Czechs | 62.5 /100 | #169 | Good 2.3% |
| Ugandans | 62.2 /100 | #170 | Good 2.3% |
| Swedes | 61.6 /100 | #171 | Good 2.3% |
| Czechoslovakians | 58.9 /100 | #172 | Average 2.3% |
| Celtics | 55.4 /100 | #173 | Average 2.3% |
| Afghans | 50.0 /100 | #174 | Average 2.3% |
| Immigrants | Jamaica | 49.1 /100 | #175 | Average 2.3% |
| Danes | 48.2 /100 | #176 | Average 2.3% |
| Colombians | 48.0 /100 | #177 | Average 2.3% |
| Costa Ricans | 44.1 /100 | #178 | Average 2.3% |
| Welsh | 44.0 /100 | #179 | Average 2.3% |
Demographics Similar to Immigrants from Nepal by Single Father Households
In terms of single father households, the demographic groups most similar to Immigrants from Nepal are Luxembourger (2.2%, a difference of 0.060%), Laotian (2.2%, a difference of 0.10%), Brazilian (2.2%, a difference of 0.19%), British (2.2%, a difference of 0.19%), and Slovak (2.2%, a difference of 0.34%).
| Demographics | Rating | Rank | Single Father Households |
| Chileans | 94.5 /100 | #136 | Exceptional 2.2% |
| Austrians | 94.2 /100 | #137 | Exceptional 2.2% |
| West Indians | 94.1 /100 | #138 | Exceptional 2.2% |
| Brazilians | 92.8 /100 | #139 | Exceptional 2.2% |
| British | 92.8 /100 | #140 | Exceptional 2.2% |
| Laotians | 92.5 /100 | #141 | Exceptional 2.2% |
| Luxembourgers | 92.3 /100 | #142 | Exceptional 2.2% |
| Immigrants | Nepal | 92.1 /100 | #143 | Exceptional 2.2% |
| Slovaks | 90.7 /100 | #144 | Exceptional 2.2% |
| Immigrants | Zimbabwe | 90.2 /100 | #145 | Exceptional 2.2% |
| Northern Europeans | 89.8 /100 | #146 | Excellent 2.2% |
| Slavs | 88.9 /100 | #147 | Excellent 2.2% |
| South American Indians | 88.5 /100 | #148 | Excellent 2.3% |
| Senegalese | 88.4 /100 | #149 | Excellent 2.3% |
| Venezuelans | 86.2 /100 | #150 | Excellent 2.3% |