Czechoslovakian vs Alsatian 3rd Grade
COMPARE
Czechoslovakian
Alsatian
3rd Grade
3rd Grade Comparison
Czechoslovakians
Alsatians
98.3%
3RD GRADE
99.8/ 100
METRIC RATING
47th/ 347
METRIC RANK
97.9%
3RD GRADE
78.3/ 100
METRIC RATING
146th/ 347
METRIC RANK
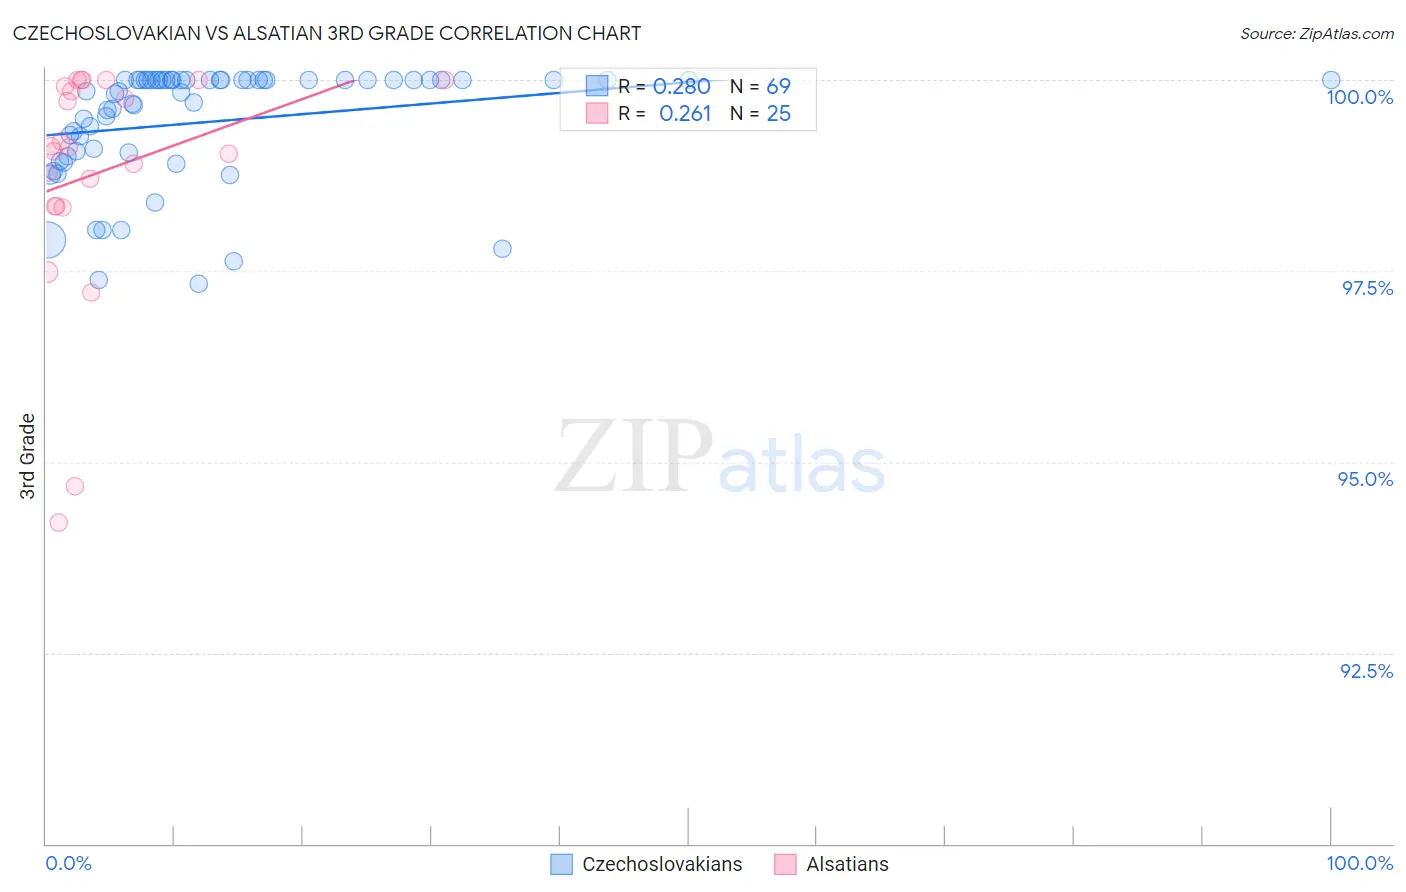
Czechoslovakian vs Alsatian 3rd Grade Correlation Chart
The statistical analysis conducted on geographies consisting of 368,668,876 people shows a weak positive correlation between the proportion of Czechoslovakians and percentage of population with at least 3rd grade education in the United States with a correlation coefficient (R) of 0.280 and weighted average of 98.3%. Similarly, the statistical analysis conducted on geographies consisting of 82,682,365 people shows a weak positive correlation between the proportion of Alsatians and percentage of population with at least 3rd grade education in the United States with a correlation coefficient (R) of 0.261 and weighted average of 97.9%, a difference of 0.44%.
3rd Grade Correlation Summary
| Measurement | Czechoslovakian | Alsatian |
| Minimum | 97.3% | 94.2% |
| Maximum | 100.0% | 100.0% |
| Range | 2.7% | 5.8% |
| Mean | 99.5% | 98.8% |
| Median | 99.9% | 99.1% |
| Interquartile 25% (IQ1) | 99.0% | 98.3% |
| Interquartile 75% (IQ3) | 100.0% | 100.0% |
| Interquartile Range (IQR) | 0.98% | 1.6% |
| Standard Deviation (Sample) | 0.76% | 1.5% |
| Standard Deviation (Population) | 0.75% | 1.5% |
Similar Demographics by 3rd Grade
Demographics Similar to Czechoslovakians by 3rd Grade
In terms of 3rd grade, the demographic groups most similar to Czechoslovakians are Ottawa (98.3%, a difference of 0.0%), Lumbee (98.3%, a difference of 0.0%), Estonian (98.3%, a difference of 0.020%), Celtic (98.3%, a difference of 0.020%), and Australian (98.3%, a difference of 0.020%).
| Demographics | Rating | Rank | 3rd Grade |
| Eastern Europeans | 99.9 /100 | #40 | Exceptional 98.3% |
| Luxembourgers | 99.9 /100 | #41 | Exceptional 98.3% |
| Belgians | 99.9 /100 | #42 | Exceptional 98.3% |
| Northern Europeans | 99.9 /100 | #43 | Exceptional 98.3% |
| Hungarians | 99.9 /100 | #44 | Exceptional 98.3% |
| Native Hawaiians | 99.9 /100 | #45 | Exceptional 98.3% |
| Ottawa | 99.8 /100 | #46 | Exceptional 98.3% |
| Czechoslovakians | 99.8 /100 | #47 | Exceptional 98.3% |
| Lumbee | 99.8 /100 | #48 | Exceptional 98.3% |
| Estonians | 99.8 /100 | #49 | Exceptional 98.3% |
| Celtics | 99.8 /100 | #50 | Exceptional 98.3% |
| Australians | 99.8 /100 | #51 | Exceptional 98.3% |
| Whites/Caucasians | 99.8 /100 | #52 | Exceptional 98.3% |
| Immigrants | Scotland | 99.8 /100 | #53 | Exceptional 98.3% |
| Bulgarians | 99.8 /100 | #54 | Exceptional 98.3% |
Demographics Similar to Alsatians by 3rd Grade
In terms of 3rd grade, the demographic groups most similar to Alsatians are Immigrants from Israel (97.9%, a difference of 0.0%), Hmong (97.9%, a difference of 0.010%), Filipino (97.9%, a difference of 0.010%), Burmese (97.9%, a difference of 0.010%), and Immigrants from Greece (97.9%, a difference of 0.010%).
| Demographics | Rating | Rank | 3rd Grade |
| Blackfeet | 86.3 /100 | #139 | Excellent 97.9% |
| Palestinians | 84.6 /100 | #140 | Excellent 97.9% |
| Immigrants | Turkey | 83.5 /100 | #141 | Excellent 97.9% |
| Hmong | 80.3 /100 | #142 | Excellent 97.9% |
| Filipinos | 79.9 /100 | #143 | Good 97.9% |
| Burmese | 79.6 /100 | #144 | Good 97.9% |
| Immigrants | Greece | 79.5 /100 | #145 | Good 97.9% |
| Alsatians | 78.3 /100 | #146 | Good 97.9% |
| Immigrants | Israel | 77.3 /100 | #147 | Good 97.9% |
| Immigrants | Moldova | 77.1 /100 | #148 | Good 97.9% |
| Immigrants | North Macedonia | 74.5 /100 | #149 | Good 97.8% |
| Jordanians | 74.5 /100 | #150 | Good 97.8% |
| Soviet Union | 72.6 /100 | #151 | Good 97.8% |
| Immigrants | South Central Asia | 69.5 /100 | #152 | Good 97.8% |
| Apache | 68.5 /100 | #153 | Good 97.8% |