Cypriot vs Immigrants from Dominica 3rd Grade
COMPARE
Cypriot
Immigrants from Dominica
3rd Grade
3rd Grade Comparison
Cypriots
Immigrants from Dominica
98.1%
3RD GRADE
98.4/ 100
METRIC RATING
95th/ 347
METRIC RANK
96.9%
3RD GRADE
0.0/ 100
METRIC RATING
298th/ 347
METRIC RANK
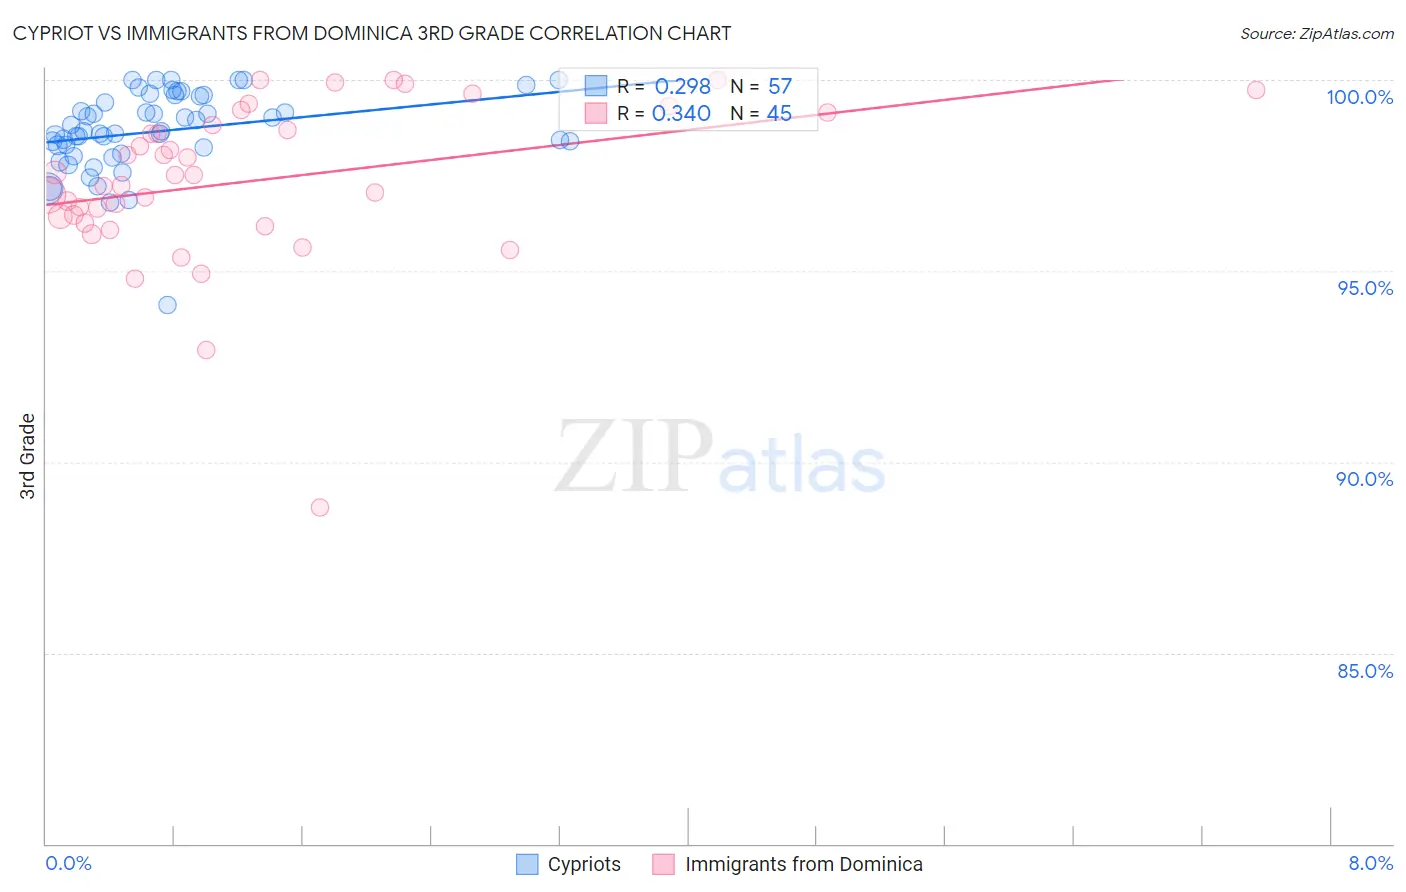
Cypriot vs Immigrants from Dominica 3rd Grade Correlation Chart
The statistical analysis conducted on geographies consisting of 61,870,289 people shows a weak positive correlation between the proportion of Cypriots and percentage of population with at least 3rd grade education in the United States with a correlation coefficient (R) of 0.298 and weighted average of 98.1%. Similarly, the statistical analysis conducted on geographies consisting of 83,794,115 people shows a mild positive correlation between the proportion of Immigrants from Dominica and percentage of population with at least 3rd grade education in the United States with a correlation coefficient (R) of 0.340 and weighted average of 96.9%, a difference of 1.3%.
3rd Grade Correlation Summary
| Measurement | Cypriot | Immigrants from Dominica |
| Minimum | 94.1% | 88.8% |
| Maximum | 100.0% | 100.0% |
| Range | 5.9% | 11.2% |
| Mean | 98.7% | 97.4% |
| Median | 98.7% | 97.5% |
| Interquartile 25% (IQ1) | 98.1% | 96.3% |
| Interquartile 75% (IQ3) | 99.6% | 99.0% |
| Interquartile Range (IQR) | 1.4% | 2.6% |
| Standard Deviation (Sample) | 1.1% | 2.1% |
| Standard Deviation (Population) | 1.1% | 2.1% |
Similar Demographics by 3rd Grade
Demographics Similar to Cypriots by 3rd Grade
In terms of 3rd grade, the demographic groups most similar to Cypriots are Immigrants from Germany (98.1%, a difference of 0.0%), Immigrants from Ireland (98.1%, a difference of 0.010%), South African (98.1%, a difference of 0.010%), Delaware (98.1%, a difference of 0.020%), and Zimbabwean (98.1%, a difference of 0.020%).
| Demographics | Rating | Rank | 3rd Grade |
| Immigrants | India | 98.8 /100 | #88 | Exceptional 98.1% |
| Delaware | 98.8 /100 | #89 | Exceptional 98.1% |
| Zimbabweans | 98.8 /100 | #90 | Exceptional 98.1% |
| Hopi | 98.7 /100 | #91 | Exceptional 98.1% |
| Immigrants | South Africa | 98.7 /100 | #92 | Exceptional 98.1% |
| Immigrants | Western Europe | 98.7 /100 | #93 | Exceptional 98.1% |
| Immigrants | Germany | 98.4 /100 | #94 | Exceptional 98.1% |
| Cypriots | 98.4 /100 | #95 | Exceptional 98.1% |
| Immigrants | Ireland | 98.2 /100 | #96 | Exceptional 98.1% |
| South Africans | 98.2 /100 | #97 | Exceptional 98.1% |
| Choctaw | 98.0 /100 | #98 | Exceptional 98.1% |
| Romanians | 98.0 /100 | #99 | Exceptional 98.1% |
| Cree | 97.9 /100 | #100 | Exceptional 98.1% |
| Puget Sound Salish | 97.9 /100 | #101 | Exceptional 98.1% |
| Immigrants | Nonimmigrants | 97.8 /100 | #102 | Exceptional 98.1% |
Demographics Similar to Immigrants from Dominica by 3rd Grade
In terms of 3rd grade, the demographic groups most similar to Immigrants from Dominica are Haitian (96.9%, a difference of 0.0%), Somali (96.8%, a difference of 0.010%), Immigrants from South Eastern Asia (96.8%, a difference of 0.020%), Immigrants (96.9%, a difference of 0.030%), and Immigrants from Cuba (96.8%, a difference of 0.030%).
| Demographics | Rating | Rank | 3rd Grade |
| Immigrants | Afghanistan | 0.0 /100 | #291 | Tragic 97.0% |
| British West Indians | 0.0 /100 | #292 | Tragic 97.0% |
| Immigrants | Grenada | 0.0 /100 | #293 | Tragic 97.0% |
| Malaysians | 0.0 /100 | #294 | Tragic 97.0% |
| Immigrants | Eritrea | 0.0 /100 | #295 | Tragic 97.0% |
| Immigrants | Immigrants | 0.0 /100 | #296 | Tragic 96.9% |
| Haitians | 0.0 /100 | #297 | Tragic 96.9% |
| Immigrants | Dominica | 0.0 /100 | #298 | Tragic 96.9% |
| Somalis | 0.0 /100 | #299 | Tragic 96.8% |
| Immigrants | South Eastern Asia | 0.0 /100 | #300 | Tragic 96.8% |
| Immigrants | Cuba | 0.0 /100 | #301 | Tragic 96.8% |
| Immigrants | Somalia | 0.0 /100 | #302 | Tragic 96.8% |
| Ecuadorians | 0.0 /100 | #303 | Tragic 96.7% |
| Immigrants | Caribbean | 0.0 /100 | #304 | Tragic 96.7% |
| Central American Indians | 0.0 /100 | #305 | Tragic 96.7% |