Cypriot vs Immigrants from Indonesia 3rd Grade
COMPARE
Cypriot
Immigrants from Indonesia
3rd Grade
3rd Grade Comparison
Cypriots
Immigrants from Indonesia
98.1%
3RD GRADE
98.4/ 100
METRIC RATING
95th/ 347
METRIC RANK
97.4%
3RD GRADE
1.4/ 100
METRIC RATING
241st/ 347
METRIC RANK
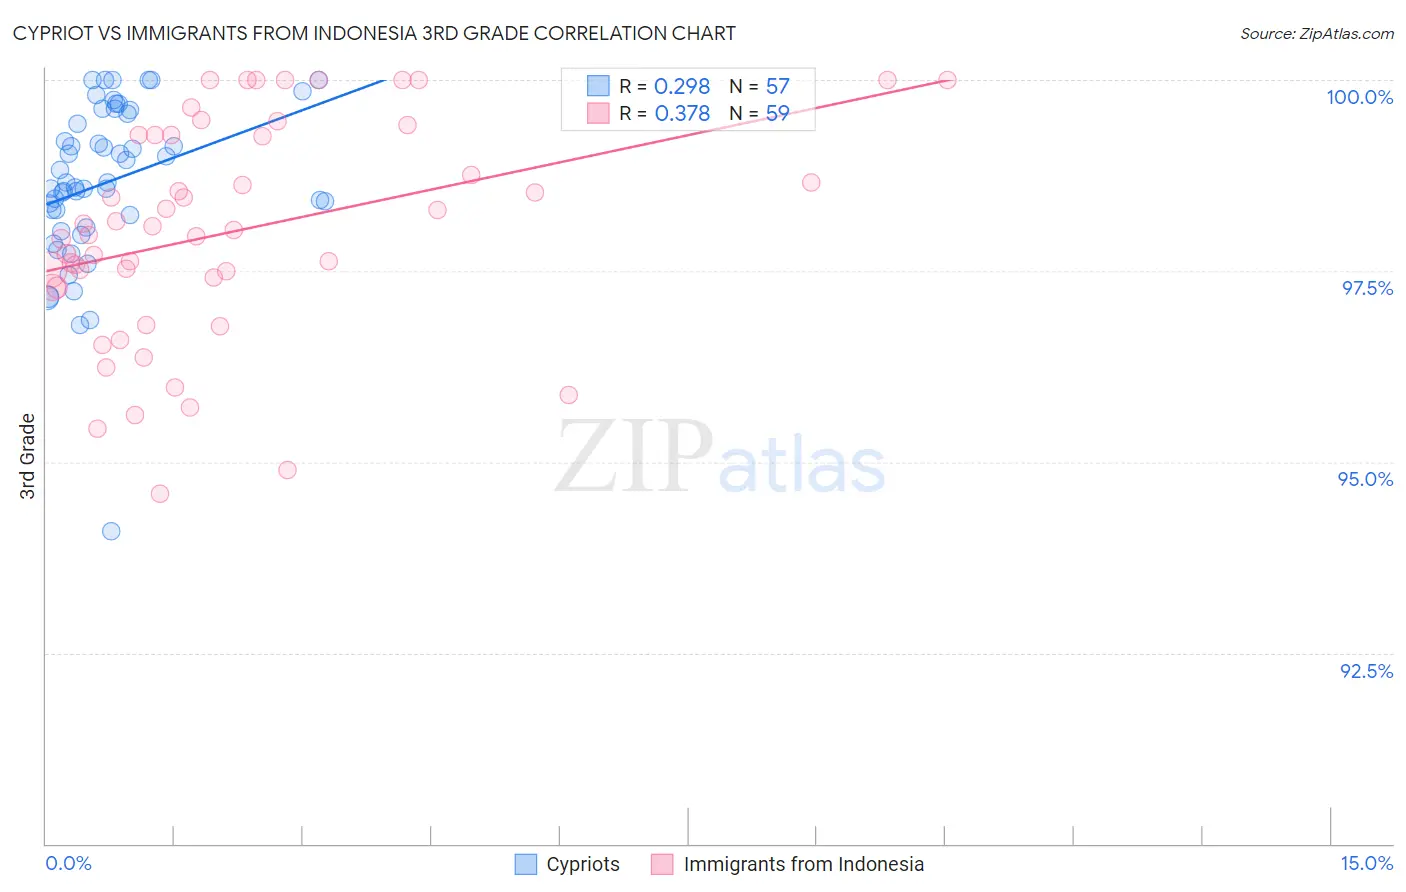
Cypriot vs Immigrants from Indonesia 3rd Grade Correlation Chart
The statistical analysis conducted on geographies consisting of 61,870,289 people shows a weak positive correlation between the proportion of Cypriots and percentage of population with at least 3rd grade education in the United States with a correlation coefficient (R) of 0.298 and weighted average of 98.1%. Similarly, the statistical analysis conducted on geographies consisting of 215,782,971 people shows a mild positive correlation between the proportion of Immigrants from Indonesia and percentage of population with at least 3rd grade education in the United States with a correlation coefficient (R) of 0.378 and weighted average of 97.4%, a difference of 0.71%.
3rd Grade Correlation Summary
| Measurement | Cypriot | Immigrants from Indonesia |
| Minimum | 94.1% | 94.6% |
| Maximum | 100.0% | 100.0% |
| Range | 5.9% | 5.4% |
| Mean | 98.7% | 98.0% |
| Median | 98.7% | 98.0% |
| Interquartile 25% (IQ1) | 98.1% | 97.3% |
| Interquartile 75% (IQ3) | 99.6% | 99.3% |
| Interquartile Range (IQR) | 1.4% | 2.0% |
| Standard Deviation (Sample) | 1.1% | 1.4% |
| Standard Deviation (Population) | 1.1% | 1.4% |
Similar Demographics by 3rd Grade
Demographics Similar to Cypriots by 3rd Grade
In terms of 3rd grade, the demographic groups most similar to Cypriots are Immigrants from Germany (98.1%, a difference of 0.0%), Immigrants from Ireland (98.1%, a difference of 0.010%), South African (98.1%, a difference of 0.010%), Delaware (98.1%, a difference of 0.020%), and Zimbabwean (98.1%, a difference of 0.020%).
| Demographics | Rating | Rank | 3rd Grade |
| Immigrants | India | 98.8 /100 | #88 | Exceptional 98.1% |
| Delaware | 98.8 /100 | #89 | Exceptional 98.1% |
| Zimbabweans | 98.8 /100 | #90 | Exceptional 98.1% |
| Hopi | 98.7 /100 | #91 | Exceptional 98.1% |
| Immigrants | South Africa | 98.7 /100 | #92 | Exceptional 98.1% |
| Immigrants | Western Europe | 98.7 /100 | #93 | Exceptional 98.1% |
| Immigrants | Germany | 98.4 /100 | #94 | Exceptional 98.1% |
| Cypriots | 98.4 /100 | #95 | Exceptional 98.1% |
| Immigrants | Ireland | 98.2 /100 | #96 | Exceptional 98.1% |
| South Africans | 98.2 /100 | #97 | Exceptional 98.1% |
| Choctaw | 98.0 /100 | #98 | Exceptional 98.1% |
| Romanians | 98.0 /100 | #99 | Exceptional 98.1% |
| Cree | 97.9 /100 | #100 | Exceptional 98.1% |
| Puget Sound Salish | 97.9 /100 | #101 | Exceptional 98.1% |
| Immigrants | Nonimmigrants | 97.8 /100 | #102 | Exceptional 98.1% |
Demographics Similar to Immigrants from Indonesia by 3rd Grade
In terms of 3rd grade, the demographic groups most similar to Immigrants from Indonesia are U.S. Virgin Islander (97.4%, a difference of 0.0%), Korean (97.4%, a difference of 0.0%), Nigerian (97.4%, a difference of 0.010%), Indian (Asian) (97.4%, a difference of 0.010%), and Immigrants from Iraq (97.4%, a difference of 0.020%).
| Demographics | Rating | Rank | 3rd Grade |
| Immigrants | Eastern Asia | 1.9 /100 | #234 | Tragic 97.4% |
| Immigrants | Iraq | 1.8 /100 | #235 | Tragic 97.4% |
| Liberians | 1.8 /100 | #236 | Tragic 97.4% |
| Colombians | 1.8 /100 | #237 | Tragic 97.4% |
| Immigrants | Uruguay | 1.7 /100 | #238 | Tragic 97.4% |
| Nigerians | 1.6 /100 | #239 | Tragic 97.4% |
| U.S. Virgin Islanders | 1.4 /100 | #240 | Tragic 97.4% |
| Immigrants | Indonesia | 1.4 /100 | #241 | Tragic 97.4% |
| Koreans | 1.3 /100 | #242 | Tragic 97.4% |
| Indians (Asian) | 1.3 /100 | #243 | Tragic 97.4% |
| Asians | 1.1 /100 | #244 | Tragic 97.4% |
| Ethiopians | 1.1 /100 | #245 | Tragic 97.4% |
| Immigrants | Senegal | 1.0 /100 | #246 | Tragic 97.4% |
| Assyrians/Chaldeans/Syriacs | 1.0 /100 | #247 | Tragic 97.4% |
| Immigrants | Eastern Africa | 0.9 /100 | #248 | Tragic 97.4% |