Cypriot vs Immigrants from Bolivia 12th Grade, No Diploma
COMPARE
Cypriot
Immigrants from Bolivia
12th Grade, No Diploma
12th Grade, No Diploma Comparison
Cypriots
Immigrants from Bolivia
93.1%
12TH GRADE, NO DIPLOMA
99.9/ 100
METRIC RATING
27th/ 347
METRIC RANK
90.6%
12TH GRADE, NO DIPLOMA
12.3/ 100
METRIC RATING
206th/ 347
METRIC RANK
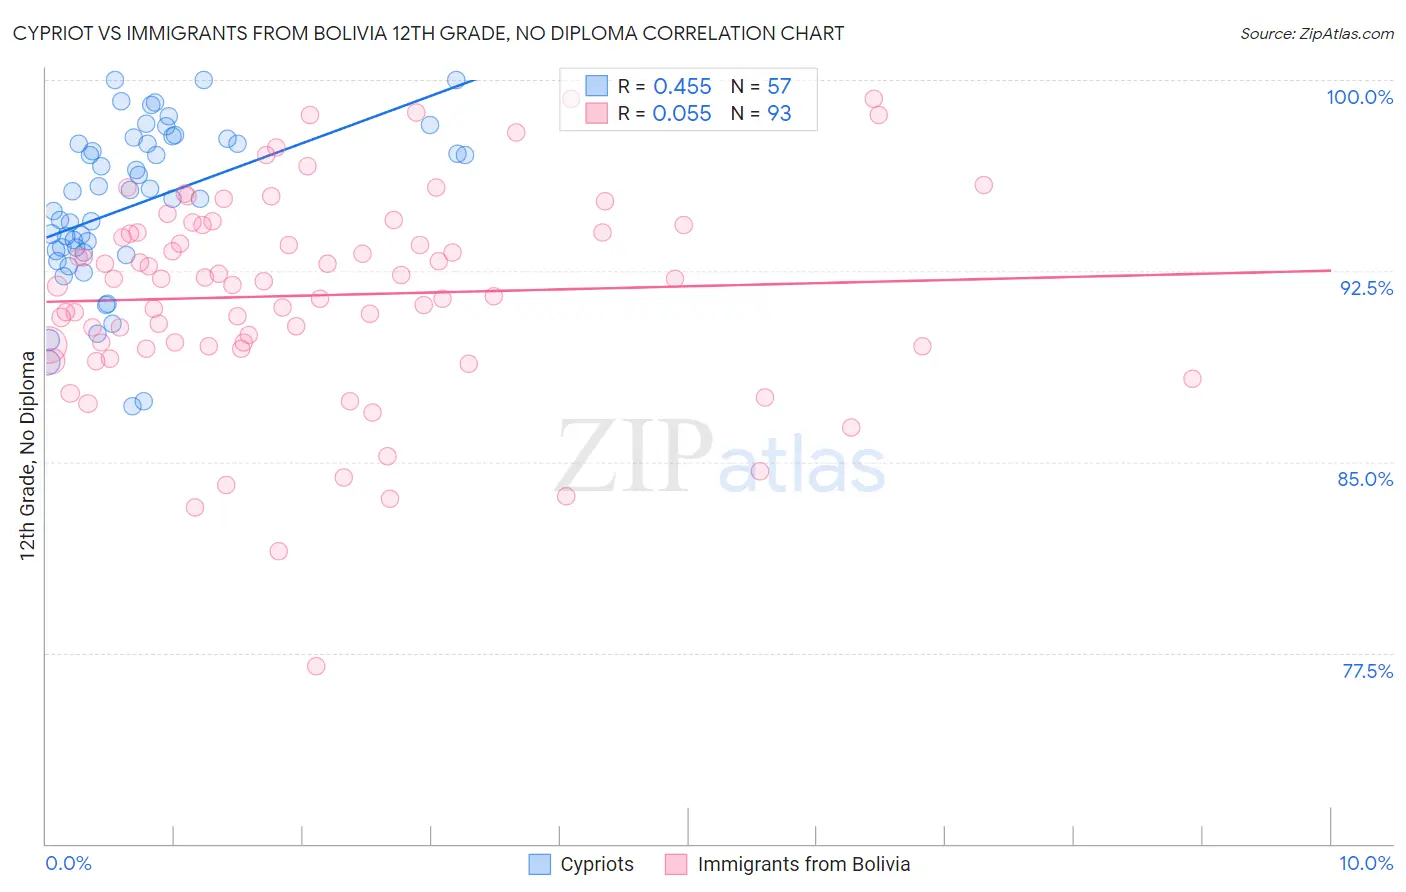
Cypriot vs Immigrants from Bolivia 12th Grade, No Diploma Correlation Chart
The statistical analysis conducted on geographies consisting of 61,870,289 people shows a moderate positive correlation between the proportion of Cypriots and percentage of population with at least 12th grade (no diploma) education in the United States with a correlation coefficient (R) of 0.455 and weighted average of 93.1%. Similarly, the statistical analysis conducted on geographies consisting of 158,727,043 people shows a slight positive correlation between the proportion of Immigrants from Bolivia and percentage of population with at least 12th grade (no diploma) education in the United States with a correlation coefficient (R) of 0.055 and weighted average of 90.6%, a difference of 2.8%.
12th Grade, No Diploma Correlation Summary
| Measurement | Cypriot | Immigrants from Bolivia |
| Minimum | 87.2% | 77.0% |
| Maximum | 100.0% | 99.3% |
| Range | 12.8% | 22.3% |
| Mean | 95.1% | 91.5% |
| Median | 95.6% | 92.1% |
| Interquartile 25% (IQ1) | 93.3% | 89.5% |
| Interquartile 75% (IQ3) | 97.6% | 94.2% |
| Interquartile Range (IQR) | 4.3% | 4.6% |
| Standard Deviation (Sample) | 3.1% | 4.1% |
| Standard Deviation (Population) | 3.1% | 4.1% |
Similar Demographics by 12th Grade, No Diploma
Demographics Similar to Cypriots by 12th Grade, No Diploma
In terms of 12th grade, no diploma, the demographic groups most similar to Cypriots are Russian (93.2%, a difference of 0.020%), Czech (93.2%, a difference of 0.030%), Immigrants from Northern Europe (93.1%, a difference of 0.040%), Thai (93.2%, a difference of 0.050%), and Iranian (93.1%, a difference of 0.050%).
| Demographics | Rating | Rank | 12th Grade, No Diploma |
| Filipinos | 99.9 /100 | #20 | Exceptional 93.2% |
| Italians | 99.9 /100 | #21 | Exceptional 93.2% |
| Estonians | 99.9 /100 | #22 | Exceptional 93.2% |
| Scandinavians | 99.9 /100 | #23 | Exceptional 93.2% |
| Thais | 99.9 /100 | #24 | Exceptional 93.2% |
| Czechs | 99.9 /100 | #25 | Exceptional 93.2% |
| Russians | 99.9 /100 | #26 | Exceptional 93.2% |
| Cypriots | 99.9 /100 | #27 | Exceptional 93.1% |
| Immigrants | Northern Europe | 99.9 /100 | #28 | Exceptional 93.1% |
| Iranians | 99.9 /100 | #29 | Exceptional 93.1% |
| Immigrants | Lithuania | 99.9 /100 | #30 | Exceptional 93.1% |
| Immigrants | Ireland | 99.9 /100 | #31 | Exceptional 93.1% |
| Europeans | 99.9 /100 | #32 | Exceptional 93.1% |
| Immigrants | Scotland | 99.9 /100 | #33 | Exceptional 93.0% |
| Okinawans | 99.9 /100 | #34 | Exceptional 93.0% |
Demographics Similar to Immigrants from Bolivia by 12th Grade, No Diploma
In terms of 12th grade, no diploma, the demographic groups most similar to Immigrants from Bolivia are Armenian (90.6%, a difference of 0.020%), Immigrants from Micronesia (90.6%, a difference of 0.040%), Immigrants from Afghanistan (90.6%, a difference of 0.040%), South American Indian (90.6%, a difference of 0.040%), and Portuguese (90.6%, a difference of 0.050%).
| Demographics | Rating | Rank | 12th Grade, No Diploma |
| Immigrants | Southern Europe | 19.9 /100 | #199 | Poor 90.8% |
| Liberians | 19.8 /100 | #200 | Poor 90.8% |
| Hawaiians | 19.7 /100 | #201 | Poor 90.8% |
| Marshallese | 18.2 /100 | #202 | Poor 90.7% |
| Tongans | 16.1 /100 | #203 | Poor 90.7% |
| French American Indians | 15.5 /100 | #204 | Poor 90.7% |
| Immigrants | Sierra Leone | 14.9 /100 | #205 | Poor 90.7% |
| Immigrants | Bolivia | 12.3 /100 | #206 | Poor 90.6% |
| Armenians | 11.6 /100 | #207 | Poor 90.6% |
| Immigrants | Micronesia | 11.0 /100 | #208 | Poor 90.6% |
| Immigrants | Afghanistan | 11.0 /100 | #209 | Poor 90.6% |
| South American Indians | 10.9 /100 | #210 | Poor 90.6% |
| Portuguese | 10.6 /100 | #211 | Poor 90.6% |
| Somalis | 10.2 /100 | #212 | Poor 90.6% |
| Costa Ricans | 9.4 /100 | #213 | Tragic 90.5% |