Immigrants from Southern Europe vs Guatemalan 11th Grade
COMPARE
Immigrants from Southern Europe
Guatemalan
11th Grade
11th Grade Comparison
Immigrants from Southern Europe
Guatemalans
92.1%
11TH GRADE
12.5/ 100
METRIC RATING
215th/ 347
METRIC RANK
86.4%
11TH GRADE
0.0/ 100
METRIC RATING
339th/ 347
METRIC RANK
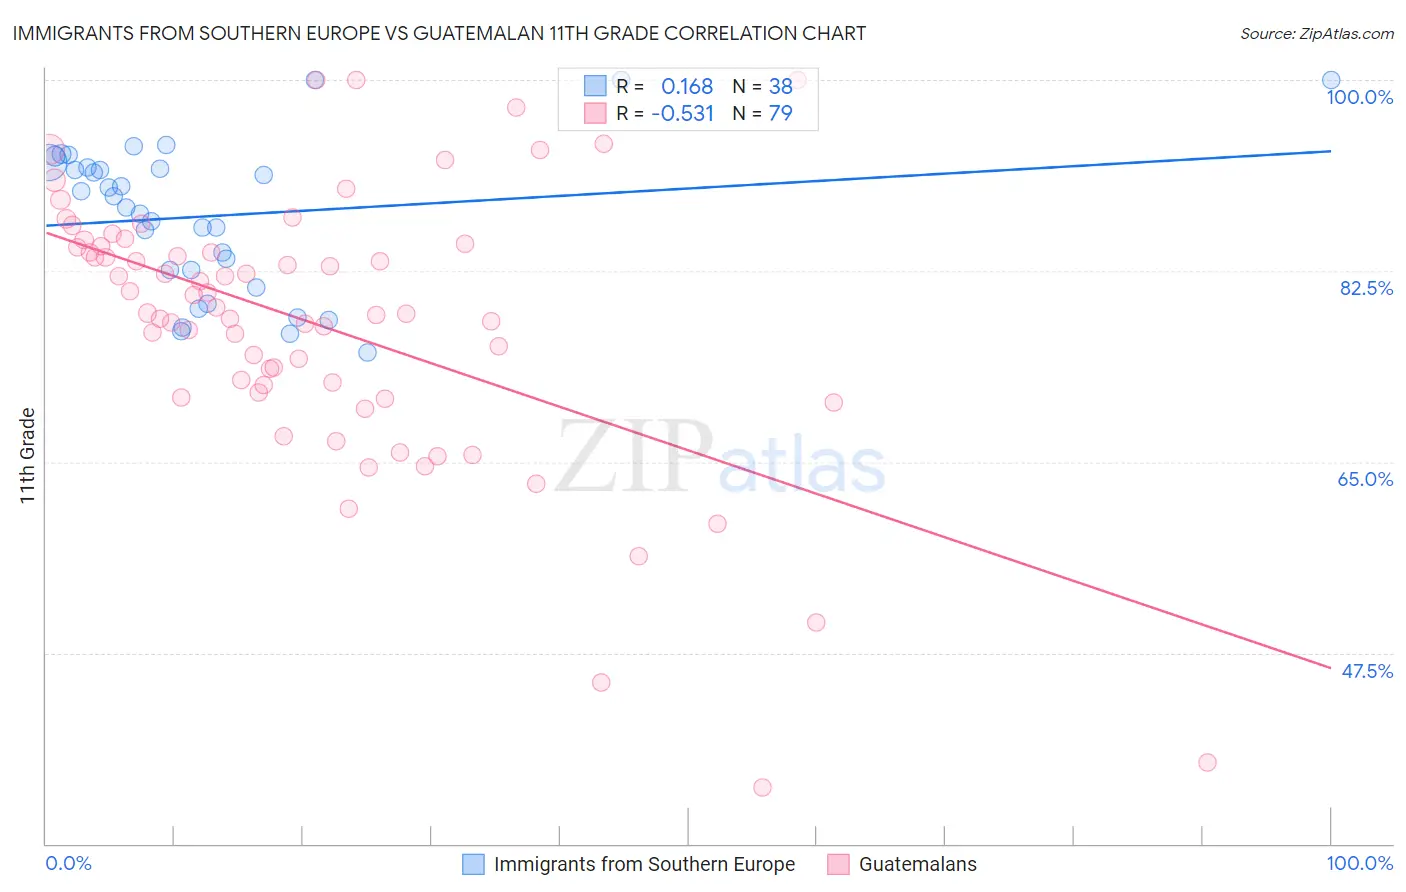
Immigrants from Southern Europe vs Guatemalan 11th Grade Correlation Chart
The statistical analysis conducted on geographies consisting of 402,804,595 people shows a poor positive correlation between the proportion of Immigrants from Southern Europe and percentage of population with at least 11th grade education in the United States with a correlation coefficient (R) of 0.168 and weighted average of 92.1%. Similarly, the statistical analysis conducted on geographies consisting of 409,566,618 people shows a substantial negative correlation between the proportion of Guatemalans and percentage of population with at least 11th grade education in the United States with a correlation coefficient (R) of -0.531 and weighted average of 86.4%, a difference of 6.6%.
11th Grade Correlation Summary
| Measurement | Immigrants from Southern Europe | Guatemalan |
| Minimum | 75.0% | 35.2% |
| Maximum | 100.0% | 100.0% |
| Range | 25.0% | 64.8% |
| Mean | 87.5% | 77.6% |
| Median | 88.8% | 78.6% |
| Interquartile 25% (IQ1) | 82.5% | 71.4% |
| Interquartile 75% (IQ3) | 92.0% | 84.8% |
| Interquartile Range (IQR) | 9.4% | 13.4% |
| Standard Deviation (Sample) | 6.8% | 12.6% |
| Standard Deviation (Population) | 6.7% | 12.5% |
Similar Demographics by 11th Grade
Demographics Similar to Immigrants from Southern Europe by 11th Grade
In terms of 11th grade, the demographic groups most similar to Immigrants from Southern Europe are Afghan (92.1%, a difference of 0.010%), Somali (92.1%, a difference of 0.020%), Immigrants from Ethiopia (92.1%, a difference of 0.030%), Immigrants from Sierra Leone (92.0%, a difference of 0.030%), and Korean (92.1%, a difference of 0.040%).
| Demographics | Rating | Rank | 11th Grade |
| Colville | 21.8 /100 | #208 | Fair 92.2% |
| Tongans | 19.8 /100 | #209 | Poor 92.2% |
| Ethiopians | 18.8 /100 | #210 | Poor 92.2% |
| Immigrants | Micronesia | 17.7 /100 | #211 | Poor 92.2% |
| Koreans | 14.4 /100 | #212 | Poor 92.1% |
| Immigrants | Ethiopia | 13.9 /100 | #213 | Poor 92.1% |
| Afghans | 12.8 /100 | #214 | Poor 92.1% |
| Immigrants | Southern Europe | 12.5 /100 | #215 | Poor 92.1% |
| Somalis | 11.6 /100 | #216 | Poor 92.1% |
| Immigrants | Sierra Leone | 11.1 /100 | #217 | Poor 92.0% |
| Blackfeet | 10.1 /100 | #218 | Poor 92.0% |
| Portuguese | 10.0 /100 | #219 | Tragic 92.0% |
| South American Indians | 7.6 /100 | #220 | Tragic 92.0% |
| Immigrants | Liberia | 7.0 /100 | #221 | Tragic 91.9% |
| Immigrants | Africa | 6.5 /100 | #222 | Tragic 91.9% |
Demographics Similar to Guatemalans by 11th Grade
In terms of 11th grade, the demographic groups most similar to Guatemalans are Salvadoran (86.2%, a difference of 0.23%), Mexican (86.1%, a difference of 0.29%), Immigrants from Latin America (86.8%, a difference of 0.49%), Immigrants from Honduras (86.9%, a difference of 0.61%), and Immigrants from Dominican Republic (86.9%, a difference of 0.62%).
| Demographics | Rating | Rank | 11th Grade |
| Immigrants | Azores | 0.0 /100 | #332 | Tragic 87.2% |
| Immigrants | Yemen | 0.0 /100 | #333 | Tragic 87.1% |
| Houma | 0.0 /100 | #334 | Tragic 87.0% |
| Central Americans | 0.0 /100 | #335 | Tragic 86.9% |
| Immigrants | Dominican Republic | 0.0 /100 | #336 | Tragic 86.9% |
| Immigrants | Honduras | 0.0 /100 | #337 | Tragic 86.9% |
| Immigrants | Latin America | 0.0 /100 | #338 | Tragic 86.8% |
| Guatemalans | 0.0 /100 | #339 | Tragic 86.4% |
| Salvadorans | 0.0 /100 | #340 | Tragic 86.2% |
| Mexicans | 0.0 /100 | #341 | Tragic 86.1% |
| Immigrants | Guatemala | 0.0 /100 | #342 | Tragic 85.8% |
| Immigrants | El Salvador | 0.0 /100 | #343 | Tragic 85.3% |
| Yakama | 0.0 /100 | #344 | Tragic 85.0% |
| Immigrants | Central America | 0.0 /100 | #345 | Tragic 84.9% |
| Spanish American Indians | 0.0 /100 | #346 | Tragic 84.7% |