Cuban vs Yup'ik 12th Grade, No Diploma
COMPARE
Cuban
Yup'ik
12th Grade, No Diploma
12th Grade, No Diploma Comparison
Cubans
Yup'ik
88.9%
12TH GRADE, NO DIPLOMA
0.0/ 100
METRIC RATING
281st/ 347
METRIC RANK
87.6%
12TH GRADE, NO DIPLOMA
0.0/ 100
METRIC RATING
308th/ 347
METRIC RANK
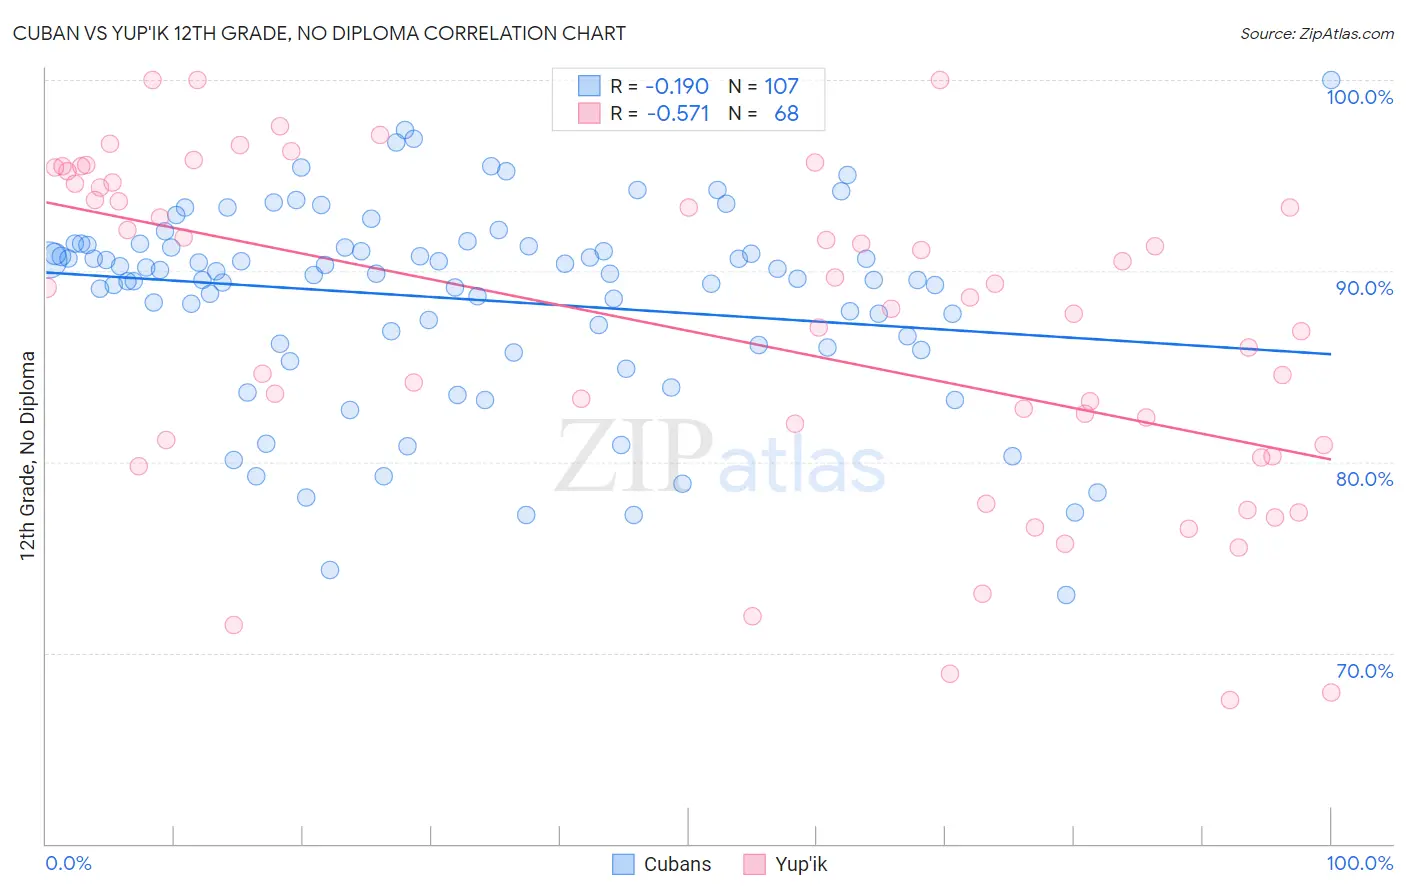
Cuban vs Yup'ik 12th Grade, No Diploma Correlation Chart
The statistical analysis conducted on geographies consisting of 449,351,555 people shows a poor negative correlation between the proportion of Cubans and percentage of population with at least 12th grade (no diploma) education in the United States with a correlation coefficient (R) of -0.190 and weighted average of 88.9%. Similarly, the statistical analysis conducted on geographies consisting of 39,964,654 people shows a substantial negative correlation between the proportion of Yup'ik and percentage of population with at least 12th grade (no diploma) education in the United States with a correlation coefficient (R) of -0.571 and weighted average of 87.6%, a difference of 1.5%.
12th Grade, No Diploma Correlation Summary
| Measurement | Cuban | Yup'ik |
| Minimum | 73.0% | 67.6% |
| Maximum | 100.0% | 100.0% |
| Range | 27.0% | 32.4% |
| Mean | 88.5% | 86.8% |
| Median | 89.8% | 88.3% |
| Interquartile 25% (IQ1) | 86.1% | 80.6% |
| Interquartile 75% (IQ3) | 91.3% | 94.5% |
| Interquartile Range (IQR) | 5.2% | 13.9% |
| Standard Deviation (Sample) | 5.2% | 8.6% |
| Standard Deviation (Population) | 5.2% | 8.5% |
Similar Demographics by 12th Grade, No Diploma
Demographics Similar to Cubans by 12th Grade, No Diploma
In terms of 12th grade, no diploma, the demographic groups most similar to Cubans are Immigrants from Laos (88.9%, a difference of 0.010%), Immigrants from Burma/Myanmar (88.9%, a difference of 0.010%), Immigrants from St. Vincent and the Grenadines (88.9%, a difference of 0.080%), Immigrants from Barbados (89.0%, a difference of 0.15%), and Immigrants from Vietnam (88.7%, a difference of 0.17%).
| Demographics | Rating | Rank | 12th Grade, No Diploma |
| Cajuns | 0.1 /100 | #274 | Tragic 89.1% |
| Immigrants | Congo | 0.1 /100 | #275 | Tragic 89.0% |
| Ute | 0.1 /100 | #276 | Tragic 89.0% |
| Immigrants | Barbados | 0.0 /100 | #277 | Tragic 89.0% |
| Immigrants | St. Vincent and the Grenadines | 0.0 /100 | #278 | Tragic 88.9% |
| Immigrants | Laos | 0.0 /100 | #279 | Tragic 88.9% |
| Immigrants | Burma/Myanmar | 0.0 /100 | #280 | Tragic 88.9% |
| Cubans | 0.0 /100 | #281 | Tragic 88.9% |
| Immigrants | Vietnam | 0.0 /100 | #282 | Tragic 88.7% |
| Paiute | 0.0 /100 | #283 | Tragic 88.7% |
| Pennsylvania Germans | 0.0 /100 | #284 | Tragic 88.7% |
| Indonesians | 0.0 /100 | #285 | Tragic 88.6% |
| Immigrants | West Indies | 0.0 /100 | #286 | Tragic 88.6% |
| Hopi | 0.0 /100 | #287 | Tragic 88.6% |
| Immigrants | Fiji | 0.0 /100 | #288 | Tragic 88.6% |
Demographics Similar to Yup'ik by 12th Grade, No Diploma
In terms of 12th grade, no diploma, the demographic groups most similar to Yup'ik are Immigrants from Armenia (87.6%, a difference of 0.030%), Immigrants from Portugal (87.6%, a difference of 0.040%), Native/Alaskan (87.7%, a difference of 0.080%), Immigrants from Cuba (87.5%, a difference of 0.080%), and Yaqui (87.5%, a difference of 0.12%).
| Demographics | Rating | Rank | 12th Grade, No Diploma |
| Immigrants | Cambodia | 0.0 /100 | #301 | Tragic 88.1% |
| Ecuadorians | 0.0 /100 | #302 | Tragic 88.0% |
| Immigrants | Bangladesh | 0.0 /100 | #303 | Tragic 88.0% |
| Vietnamese | 0.0 /100 | #304 | Tragic 87.9% |
| Immigrants | Dominica | 0.0 /100 | #305 | Tragic 87.7% |
| Natives/Alaskans | 0.0 /100 | #306 | Tragic 87.7% |
| Immigrants | Portugal | 0.0 /100 | #307 | Tragic 87.6% |
| Yup'ik | 0.0 /100 | #308 | Tragic 87.6% |
| Immigrants | Armenia | 0.0 /100 | #309 | Tragic 87.6% |
| Immigrants | Cuba | 0.0 /100 | #310 | Tragic 87.5% |
| Yaqui | 0.0 /100 | #311 | Tragic 87.5% |
| Immigrants | Ecuador | 0.0 /100 | #312 | Tragic 87.5% |
| Immigrants | Caribbean | 0.0 /100 | #313 | Tragic 87.4% |
| Cape Verdeans | 0.0 /100 | #314 | Tragic 87.4% |
| Nicaraguans | 0.0 /100 | #315 | Tragic 87.3% |