Mexican American Indian vs Czechoslovakian 7th Grade
COMPARE
Mexican American Indian
Czechoslovakian
7th Grade
7th Grade Comparison
Mexican American Indians
Czechoslovakians
92.6%
7TH GRADE
0.0/ 100
METRIC RATING
335th/ 347
METRIC RANK
97.1%
7TH GRADE
99.9/ 100
METRIC RATING
45th/ 347
METRIC RANK
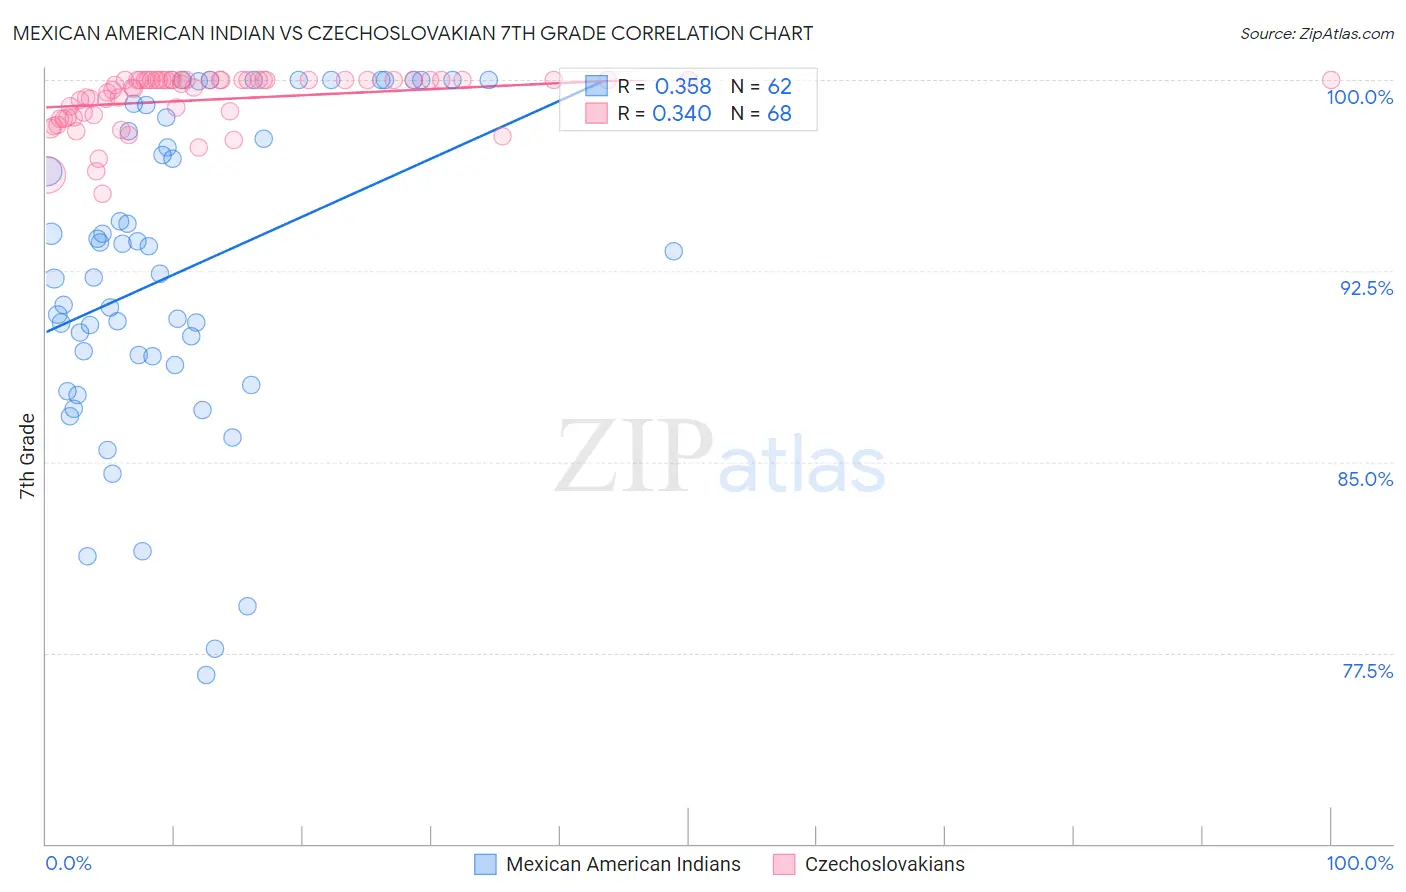
Mexican American Indian vs Czechoslovakian 7th Grade Correlation Chart
The statistical analysis conducted on geographies consisting of 317,621,104 people shows a mild positive correlation between the proportion of Mexican American Indians and percentage of population with at least 7th grade education in the United States with a correlation coefficient (R) of 0.358 and weighted average of 92.6%. Similarly, the statistical analysis conducted on geographies consisting of 368,666,801 people shows a mild positive correlation between the proportion of Czechoslovakians and percentage of population with at least 7th grade education in the United States with a correlation coefficient (R) of 0.340 and weighted average of 97.1%, a difference of 4.9%.
7th Grade Correlation Summary
| Measurement | Mexican American Indian | Czechoslovakian |
| Minimum | 76.6% | 95.5% |
| Maximum | 100.0% | 100.0% |
| Range | 23.4% | 4.5% |
| Mean | 92.5% | 99.2% |
| Median | 92.8% | 99.9% |
| Interquartile 25% (IQ1) | 89.2% | 98.6% |
| Interquartile 75% (IQ3) | 98.0% | 100.0% |
| Interquartile Range (IQR) | 8.8% | 1.4% |
| Standard Deviation (Sample) | 6.1% | 1.1% |
| Standard Deviation (Population) | 6.0% | 1.1% |
Similar Demographics by 7th Grade
Demographics Similar to Mexican American Indians by 7th Grade
In terms of 7th grade, the demographic groups most similar to Mexican American Indians are Immigrants from Honduras (92.5%, a difference of 0.070%), Immigrants from Yemen (92.6%, a difference of 0.10%), Immigrants from Armenia (92.7%, a difference of 0.18%), Hispanic or Latino (92.7%, a difference of 0.20%), and Honduran (92.9%, a difference of 0.34%).
| Demographics | Rating | Rank | 7th Grade |
| Immigrants | Nicaragua | 0.0 /100 | #328 | Tragic 93.0% |
| Immigrants | Azores | 0.0 /100 | #329 | Tragic 93.0% |
| Immigrants | Dominican Republic | 0.0 /100 | #330 | Tragic 92.9% |
| Hondurans | 0.0 /100 | #331 | Tragic 92.9% |
| Hispanics or Latinos | 0.0 /100 | #332 | Tragic 92.7% |
| Immigrants | Armenia | 0.0 /100 | #333 | Tragic 92.7% |
| Immigrants | Yemen | 0.0 /100 | #334 | Tragic 92.6% |
| Mexican American Indians | 0.0 /100 | #335 | Tragic 92.6% |
| Immigrants | Honduras | 0.0 /100 | #336 | Tragic 92.5% |
| Immigrants | Latin America | 0.0 /100 | #337 | Tragic 92.2% |
| Central Americans | 0.0 /100 | #338 | Tragic 92.1% |
| Mexicans | 0.0 /100 | #339 | Tragic 91.9% |
| Yakama | 0.0 /100 | #340 | Tragic 91.7% |
| Guatemalans | 0.0 /100 | #341 | Tragic 91.7% |
| Salvadorans | 0.0 /100 | #342 | Tragic 91.5% |
Demographics Similar to Czechoslovakians by 7th Grade
In terms of 7th grade, the demographic groups most similar to Czechoslovakians are Aleut (97.1%, a difference of 0.0%), Maltese (97.1%, a difference of 0.010%), Northern European (97.1%, a difference of 0.010%), Bulgarian (97.1%, a difference of 0.030%), and Celtic (97.1%, a difference of 0.030%).
| Demographics | Rating | Rank | 7th Grade |
| Belgians | 100.0 /100 | #38 | Exceptional 97.2% |
| Latvians | 100.0 /100 | #39 | Exceptional 97.2% |
| Luxembourgers | 100.0 /100 | #40 | Exceptional 97.2% |
| Eastern Europeans | 100.0 /100 | #41 | Exceptional 97.2% |
| Chinese | 99.9 /100 | #42 | Exceptional 97.1% |
| Maltese | 99.9 /100 | #43 | Exceptional 97.1% |
| Northern Europeans | 99.9 /100 | #44 | Exceptional 97.1% |
| Czechoslovakians | 99.9 /100 | #45 | Exceptional 97.1% |
| Aleuts | 99.9 /100 | #46 | Exceptional 97.1% |
| Bulgarians | 99.9 /100 | #47 | Exceptional 97.1% |
| Celtics | 99.9 /100 | #48 | Exceptional 97.1% |
| Slavs | 99.9 /100 | #49 | Exceptional 97.1% |
| Immigrants | Scotland | 99.9 /100 | #50 | Exceptional 97.1% |
| Estonians | 99.9 /100 | #51 | Exceptional 97.0% |
| Greeks | 99.9 /100 | #52 | Exceptional 97.0% |