Croatian vs Taiwanese Associate's Degree
COMPARE
Croatian
Taiwanese
Associate's Degree
Associate's Degree Comparison
Croatians
Taiwanese
49.3%
ASSOCIATE'S DEGREE
96.8/ 100
METRIC RATING
105th/ 347
METRIC RANK
47.7%
ASSOCIATE'S DEGREE
83.3/ 100
METRIC RATING
141st/ 347
METRIC RANK
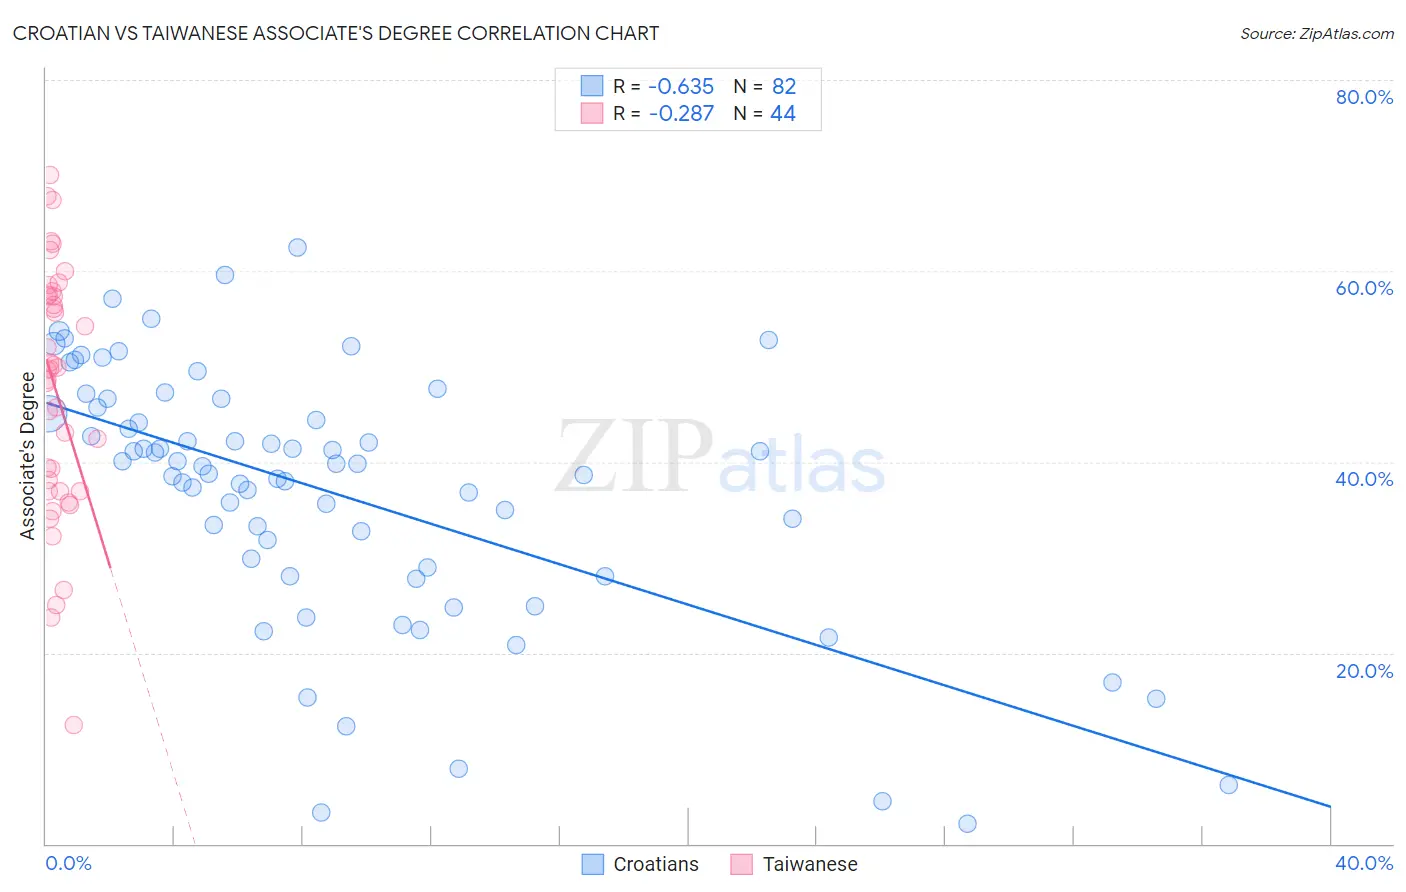
Croatian vs Taiwanese Associate's Degree Correlation Chart
The statistical analysis conducted on geographies consisting of 375,715,670 people shows a significant negative correlation between the proportion of Croatians and percentage of population with at least associate's degree education in the United States with a correlation coefficient (R) of -0.635 and weighted average of 49.3%. Similarly, the statistical analysis conducted on geographies consisting of 31,724,936 people shows a weak negative correlation between the proportion of Taiwanese and percentage of population with at least associate's degree education in the United States with a correlation coefficient (R) of -0.287 and weighted average of 47.7%, a difference of 3.3%.
Associate's Degree Correlation Summary
| Measurement | Croatian | Taiwanese |
| Minimum | 2.1% | 12.5% |
| Maximum | 62.5% | 70.0% |
| Range | 60.4% | 57.5% |
| Mean | 36.8% | 47.4% |
| Median | 39.7% | 49.7% |
| Interquartile 25% (IQ1) | 29.0% | 36.9% |
| Interquartile 75% (IQ3) | 45.8% | 57.5% |
| Interquartile Range (IQR) | 16.8% | 20.5% |
| Standard Deviation (Sample) | 13.4% | 13.1% |
| Standard Deviation (Population) | 13.4% | 12.9% |
Similar Demographics by Associate's Degree
Demographics Similar to Croatians by Associate's Degree
In terms of associate's degree, the demographic groups most similar to Croatians are Immigrants from Italy (49.3%, a difference of 0.0%), Syrian (49.3%, a difference of 0.030%), Jordanian (49.2%, a difference of 0.10%), Venezuelan (49.4%, a difference of 0.15%), and Ukrainian (49.4%, a difference of 0.21%).
| Demographics | Rating | Rank | Associate's Degree |
| Immigrants | Northern Africa | 97.9 /100 | #98 | Exceptional 49.7% |
| Macedonians | 97.8 /100 | #99 | Exceptional 49.6% |
| Immigrants | Nepal | 97.5 /100 | #100 | Exceptional 49.5% |
| Northern Europeans | 97.3 /100 | #101 | Exceptional 49.5% |
| Chileans | 97.3 /100 | #102 | Exceptional 49.4% |
| Ukrainians | 97.1 /100 | #103 | Exceptional 49.4% |
| Venezuelans | 97.0 /100 | #104 | Exceptional 49.4% |
| Croatians | 96.8 /100 | #105 | Exceptional 49.3% |
| Immigrants | Italy | 96.7 /100 | #106 | Exceptional 49.3% |
| Syrians | 96.7 /100 | #107 | Exceptional 49.3% |
| Jordanians | 96.6 /100 | #108 | Exceptional 49.2% |
| Immigrants | Morocco | 96.3 /100 | #109 | Exceptional 49.2% |
| Austrians | 95.8 /100 | #110 | Exceptional 49.1% |
| Immigrants | Venezuela | 95.8 /100 | #111 | Exceptional 49.1% |
| Immigrants | Chile | 95.3 /100 | #112 | Exceptional 49.0% |
Demographics Similar to Taiwanese by Associate's Degree
In terms of associate's degree, the demographic groups most similar to Taiwanese are Sierra Leonean (47.7%, a difference of 0.050%), Immigrants from Southern Europe (47.8%, a difference of 0.15%), Slovene (47.9%, a difference of 0.24%), Norwegian (47.6%, a difference of 0.28%), and Slavic (47.6%, a difference of 0.34%).
| Demographics | Rating | Rank | Associate's Degree |
| Moroccans | 89.3 /100 | #134 | Excellent 48.2% |
| Europeans | 89.0 /100 | #135 | Excellent 48.2% |
| Pakistanis | 88.0 /100 | #136 | Excellent 48.1% |
| Immigrants | Eritrea | 87.8 /100 | #137 | Excellent 48.1% |
| Poles | 87.3 /100 | #138 | Excellent 48.0% |
| Slovenes | 85.1 /100 | #139 | Excellent 47.9% |
| Immigrants | Southern Europe | 84.4 /100 | #140 | Excellent 47.8% |
| Taiwanese | 83.3 /100 | #141 | Excellent 47.7% |
| Sierra Leoneans | 82.9 /100 | #142 | Excellent 47.7% |
| Norwegians | 81.0 /100 | #143 | Excellent 47.6% |
| Slavs | 80.5 /100 | #144 | Excellent 47.6% |
| Canadians | 79.0 /100 | #145 | Good 47.5% |
| Immigrants | Sudan | 77.9 /100 | #146 | Good 47.4% |
| Danes | 77.3 /100 | #147 | Good 47.4% |
| South American Indians | 76.7 /100 | #148 | Good 47.4% |