Croatian vs Nonimmigrants 6th Grade
COMPARE
Croatian
Nonimmigrants
6th Grade
6th Grade Comparison
Croatians
Nonimmigrants
98.0%
6TH GRADE
100.0/ 100
METRIC RATING
24th/ 347
METRIC RANK
97.4%
6TH GRADE
97.3/ 100
METRIC RATING
108th/ 347
METRIC RANK
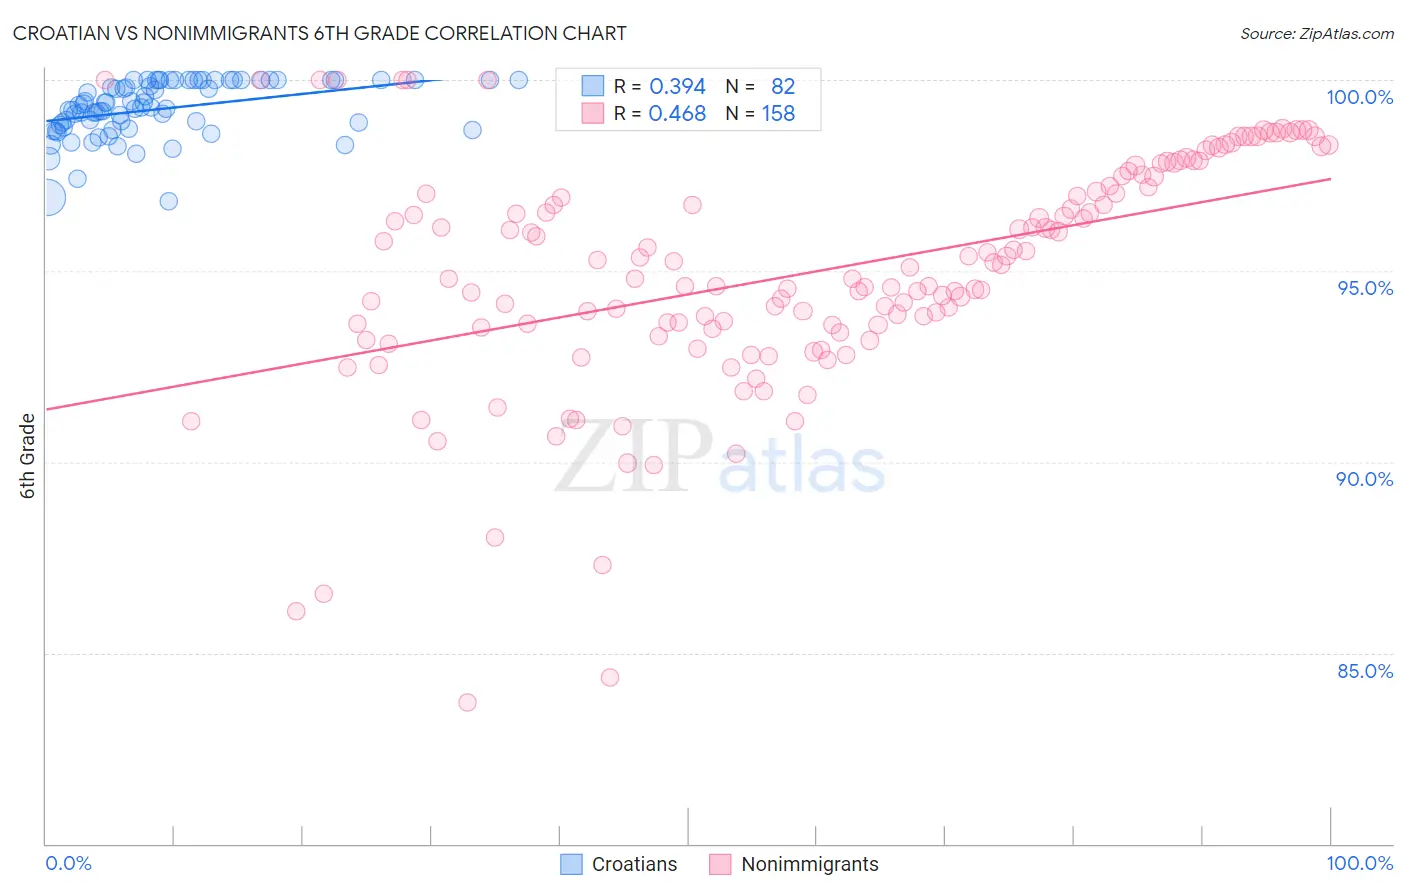
Croatian vs Nonimmigrants 6th Grade Correlation Chart
The statistical analysis conducted on geographies consisting of 375,733,612 people shows a mild positive correlation between the proportion of Croatians and percentage of population with at least 6th grade education in the United States with a correlation coefficient (R) of 0.394 and weighted average of 98.0%. Similarly, the statistical analysis conducted on geographies consisting of 585,374,489 people shows a moderate positive correlation between the proportion of Nonimmigrants and percentage of population with at least 6th grade education in the United States with a correlation coefficient (R) of 0.468 and weighted average of 97.4%, a difference of 0.60%.
6th Grade Correlation Summary
| Measurement | Croatian | Nonimmigrants |
| Minimum | 96.8% | 83.7% |
| Maximum | 100.0% | 100.0% |
| Range | 3.2% | 16.3% |
| Mean | 99.2% | 95.0% |
| Median | 99.3% | 95.1% |
| Interquartile 25% (IQ1) | 98.8% | 93.5% |
| Interquartile 75% (IQ3) | 100.0% | 97.2% |
| Interquartile Range (IQR) | 1.2% | 3.7% |
| Standard Deviation (Sample) | 0.74% | 3.0% |
| Standard Deviation (Population) | 0.73% | 3.0% |
Similar Demographics by 6th Grade
Demographics Similar to Croatians by 6th Grade
In terms of 6th grade, the demographic groups most similar to Croatians are Danish (98.0%, a difference of 0.010%), Sioux (98.0%, a difference of 0.010%), Scotch-Irish (98.0%, a difference of 0.010%), Czech (98.0%, a difference of 0.020%), and Lithuanian (98.1%, a difference of 0.030%).
| Demographics | Rating | Rank | 6th Grade |
| Poles | 100.0 /100 | #17 | Exceptional 98.1% |
| Pennsylvania Germans | 100.0 /100 | #18 | Exceptional 98.1% |
| Irish | 100.0 /100 | #19 | Exceptional 98.1% |
| Finns | 100.0 /100 | #20 | Exceptional 98.1% |
| Lithuanians | 100.0 /100 | #21 | Exceptional 98.1% |
| Danes | 100.0 /100 | #22 | Exceptional 98.0% |
| Sioux | 100.0 /100 | #23 | Exceptional 98.0% |
| Croatians | 100.0 /100 | #24 | Exceptional 98.0% |
| Scotch-Irish | 100.0 /100 | #25 | Exceptional 98.0% |
| Czechs | 100.0 /100 | #26 | Exceptional 98.0% |
| Yup'ik | 100.0 /100 | #27 | Exceptional 98.0% |
| Scandinavians | 100.0 /100 | #28 | Exceptional 98.0% |
| French | 100.0 /100 | #29 | Exceptional 98.0% |
| French Canadians | 100.0 /100 | #30 | Exceptional 98.0% |
| Europeans | 100.0 /100 | #31 | Exceptional 98.0% |
Demographics Similar to Nonimmigrants by 6th Grade
In terms of 6th grade, the demographic groups most similar to Nonimmigrants are Immigrants from Czechoslovakia (97.4%, a difference of 0.0%), Immigrants from Singapore (97.5%, a difference of 0.010%), Menominee (97.5%, a difference of 0.020%), Thai (97.4%, a difference of 0.020%), and Iroquois (97.4%, a difference of 0.020%).
| Demographics | Rating | Rank | 6th Grade |
| South Africans | 98.2 /100 | #101 | Exceptional 97.5% |
| Choctaw | 98.0 /100 | #102 | Exceptional 97.5% |
| Bhutanese | 98.0 /100 | #103 | Exceptional 97.5% |
| German Russians | 97.9 /100 | #104 | Exceptional 97.5% |
| Cheyenne | 97.9 /100 | #105 | Exceptional 97.5% |
| Menominee | 97.7 /100 | #106 | Exceptional 97.5% |
| Immigrants | Singapore | 97.6 /100 | #107 | Exceptional 97.5% |
| Immigrants | Nonimmigrants | 97.3 /100 | #108 | Exceptional 97.4% |
| Immigrants | Czechoslovakia | 97.3 /100 | #109 | Exceptional 97.4% |
| Thais | 96.9 /100 | #110 | Exceptional 97.4% |
| Iroquois | 96.9 /100 | #111 | Exceptional 97.4% |
| Immigrants | Latvia | 96.7 /100 | #112 | Exceptional 97.4% |
| Immigrants | Saudi Arabia | 96.5 /100 | #113 | Exceptional 97.4% |
| Colville | 96.4 /100 | #114 | Exceptional 97.4% |
| Immigrants | Switzerland | 95.7 /100 | #115 | Exceptional 97.4% |