Croatian vs Immigrants from Poland 11th Grade
COMPARE
Croatian
Immigrants from Poland
11th Grade
11th Grade Comparison
Croatians
Immigrants from Poland
94.7%
11TH GRADE
100.0/ 100
METRIC RATING
8th/ 347
METRIC RANK
92.8%
11TH GRADE
78.5/ 100
METRIC RATING
149th/ 347
METRIC RANK
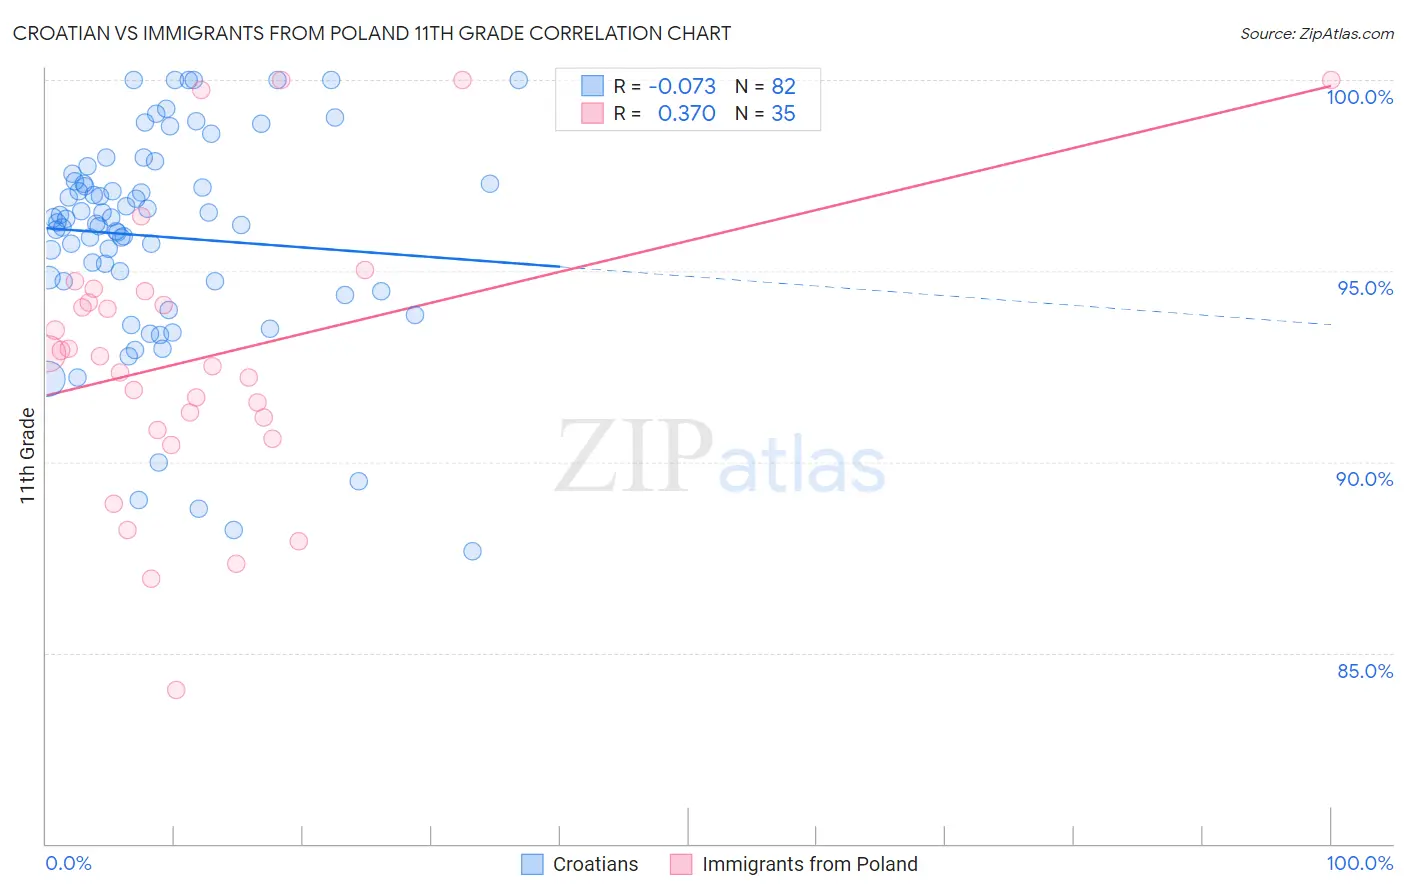
Croatian vs Immigrants from Poland 11th Grade Correlation Chart
The statistical analysis conducted on geographies consisting of 375,734,068 people shows a slight negative correlation between the proportion of Croatians and percentage of population with at least 11th grade education in the United States with a correlation coefficient (R) of -0.073 and weighted average of 94.7%. Similarly, the statistical analysis conducted on geographies consisting of 304,861,877 people shows a mild positive correlation between the proportion of Immigrants from Poland and percentage of population with at least 11th grade education in the United States with a correlation coefficient (R) of 0.370 and weighted average of 92.8%, a difference of 2.1%.
11th Grade Correlation Summary
| Measurement | Croatian | Immigrants from Poland |
| Minimum | 87.7% | 84.0% |
| Maximum | 100.0% | 100.0% |
| Range | 12.3% | 16.0% |
| Mean | 95.9% | 92.7% |
| Median | 96.3% | 92.8% |
| Interquartile 25% (IQ1) | 94.7% | 90.8% |
| Interquartile 75% (IQ3) | 97.3% | 94.5% |
| Interquartile Range (IQR) | 2.6% | 3.6% |
| Standard Deviation (Sample) | 2.8% | 3.7% |
| Standard Deviation (Population) | 2.8% | 3.6% |
Similar Demographics by 11th Grade
Demographics Similar to Croatians by 11th Grade
In terms of 11th grade, the demographic groups most similar to Croatians are Polish (94.8%, a difference of 0.010%), Danish (94.7%, a difference of 0.040%), Lithuanian (94.8%, a difference of 0.060%), Finnish (94.7%, a difference of 0.090%), and German (94.7%, a difference of 0.090%).
| Demographics | Rating | Rank | 11th Grade |
| Norwegians | 100.0 /100 | #1 | Exceptional 95.2% |
| Swedes | 100.0 /100 | #2 | Exceptional 94.9% |
| Slovenes | 100.0 /100 | #3 | Exceptional 94.9% |
| Slovaks | 100.0 /100 | #4 | Exceptional 94.9% |
| Carpatho Rusyns | 100.0 /100 | #5 | Exceptional 94.8% |
| Lithuanians | 100.0 /100 | #6 | Exceptional 94.8% |
| Poles | 100.0 /100 | #7 | Exceptional 94.8% |
| Croatians | 100.0 /100 | #8 | Exceptional 94.7% |
| Danes | 100.0 /100 | #9 | Exceptional 94.7% |
| Finns | 100.0 /100 | #10 | Exceptional 94.7% |
| Germans | 100.0 /100 | #11 | Exceptional 94.7% |
| Latvians | 100.0 /100 | #12 | Exceptional 94.7% |
| Chinese | 100.0 /100 | #13 | Exceptional 94.6% |
| Eastern Europeans | 100.0 /100 | #14 | Exceptional 94.6% |
| Bulgarians | 100.0 /100 | #15 | Exceptional 94.5% |
Demographics Similar to Immigrants from Poland by 11th Grade
In terms of 11th grade, the demographic groups most similar to Immigrants from Poland are Immigrants from Kenya (92.8%, a difference of 0.0%), Hmong (92.8%, a difference of 0.0%), Iroquois (92.8%, a difference of 0.010%), Immigrants from Egypt (92.8%, a difference of 0.010%), and Pakistani (92.8%, a difference of 0.020%).
| Demographics | Rating | Rank | 11th Grade |
| Kenyans | 82.0 /100 | #142 | Excellent 92.9% |
| Ugandans | 81.4 /100 | #143 | Excellent 92.9% |
| Assyrians/Chaldeans/Syriacs | 80.5 /100 | #144 | Excellent 92.8% |
| Pakistanis | 79.6 /100 | #145 | Good 92.8% |
| Iroquois | 79.1 /100 | #146 | Good 92.8% |
| Immigrants | Kenya | 78.7 /100 | #147 | Good 92.8% |
| Hmong | 78.6 /100 | #148 | Good 92.8% |
| Immigrants | Poland | 78.5 /100 | #149 | Good 92.8% |
| Immigrants | Egypt | 77.5 /100 | #150 | Good 92.8% |
| Potawatomi | 74.3 /100 | #151 | Good 92.8% |
| Iraqis | 74.2 /100 | #152 | Good 92.8% |
| Brazilians | 73.9 /100 | #153 | Good 92.8% |
| Osage | 73.4 /100 | #154 | Good 92.7% |
| Argentineans | 73.4 /100 | #155 | Good 92.7% |
| Immigrants | Spain | 73.0 /100 | #156 | Good 92.7% |