Immigrants from Norway vs Celtic 7th Grade
COMPARE
Immigrants from Norway
Celtic
7th Grade
7th Grade Comparison
Immigrants from Norway
Celtics
96.5%
7TH GRADE
95.2/ 100
METRIC RATING
119th/ 347
METRIC RANK
97.1%
7TH GRADE
99.9/ 100
METRIC RATING
48th/ 347
METRIC RANK
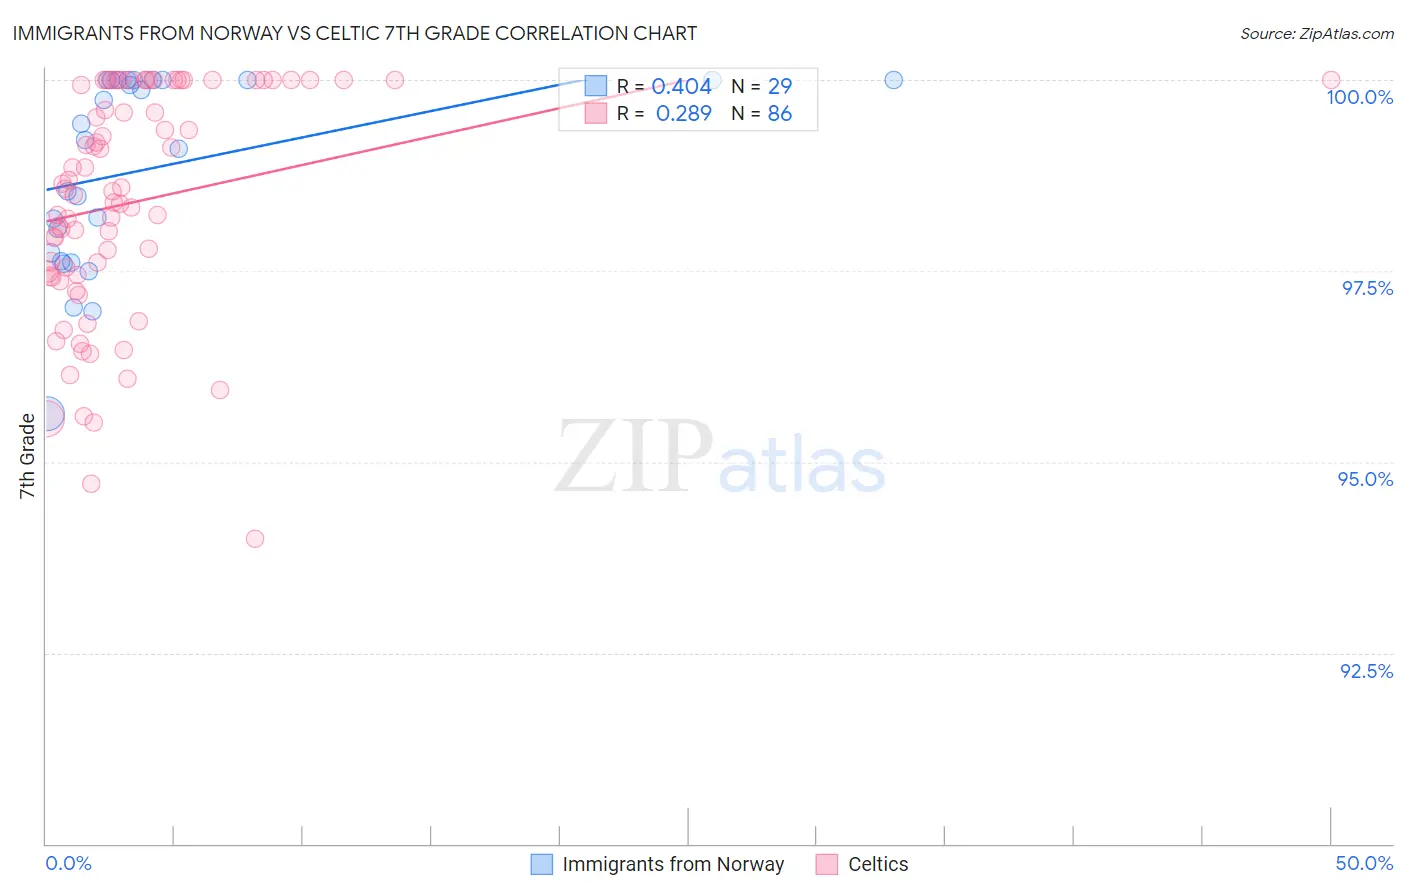
Immigrants from Norway vs Celtic 7th Grade Correlation Chart
The statistical analysis conducted on geographies consisting of 116,716,420 people shows a moderate positive correlation between the proportion of Immigrants from Norway and percentage of population with at least 7th grade education in the United States with a correlation coefficient (R) of 0.404 and weighted average of 96.5%. Similarly, the statistical analysis conducted on geographies consisting of 168,875,339 people shows a weak positive correlation between the proportion of Celtics and percentage of population with at least 7th grade education in the United States with a correlation coefficient (R) of 0.289 and weighted average of 97.1%, a difference of 0.61%.
7th Grade Correlation Summary
| Measurement | Immigrants from Norway | Celtic |
| Minimum | 95.6% | 94.0% |
| Maximum | 100.0% | 100.0% |
| Range | 4.4% | 6.0% |
| Mean | 98.8% | 98.4% |
| Median | 99.2% | 98.6% |
| Interquartile 25% (IQ1) | 97.7% | 97.4% |
| Interquartile 75% (IQ3) | 100.0% | 100.0% |
| Interquartile Range (IQR) | 2.3% | 2.6% |
| Standard Deviation (Sample) | 1.2% | 1.5% |
| Standard Deviation (Population) | 1.2% | 1.5% |
Similar Demographics by 7th Grade
Demographics Similar to Immigrants from Norway by 7th Grade
In terms of 7th grade, the demographic groups most similar to Immigrants from Norway are Immigrants from Japan (96.5%, a difference of 0.010%), Immigrants from Croatia (96.5%, a difference of 0.010%), Cheyenne (96.5%, a difference of 0.010%), Immigrants from Europe (96.5%, a difference of 0.010%), and Immigrants from Moldova (96.5%, a difference of 0.020%).
| Demographics | Rating | Rank | 7th Grade |
| Immigrants | Nonimmigrants | 97.0 /100 | #112 | Exceptional 96.5% |
| Pueblo | 96.8 /100 | #113 | Exceptional 96.5% |
| Immigrants | Zimbabwe | 96.6 /100 | #114 | Exceptional 96.5% |
| Choctaw | 96.6 /100 | #115 | Exceptional 96.5% |
| Syrians | 96.6 /100 | #116 | Exceptional 96.5% |
| Immigrants | Moldova | 95.7 /100 | #117 | Exceptional 96.5% |
| Immigrants | Japan | 95.5 /100 | #118 | Exceptional 96.5% |
| Immigrants | Norway | 95.2 /100 | #119 | Exceptional 96.5% |
| Immigrants | Croatia | 95.0 /100 | #120 | Exceptional 96.5% |
| Cheyenne | 94.9 /100 | #121 | Exceptional 96.5% |
| Immigrants | Europe | 94.8 /100 | #122 | Exceptional 96.5% |
| Immigrants | France | 94.7 /100 | #123 | Exceptional 96.5% |
| Immigrants | Switzerland | 94.5 /100 | #124 | Exceptional 96.5% |
| Immigrants | Bulgaria | 94.0 /100 | #125 | Exceptional 96.4% |
| Palestinians | 93.5 /100 | #126 | Exceptional 96.4% |
Demographics Similar to Celtics by 7th Grade
In terms of 7th grade, the demographic groups most similar to Celtics are Bulgarian (97.1%, a difference of 0.010%), Slavic (97.1%, a difference of 0.010%), Immigrants from Scotland (97.1%, a difference of 0.010%), Czechoslovakian (97.1%, a difference of 0.030%), and Aleut (97.1%, a difference of 0.030%).
| Demographics | Rating | Rank | 7th Grade |
| Eastern Europeans | 100.0 /100 | #41 | Exceptional 97.2% |
| Chinese | 99.9 /100 | #42 | Exceptional 97.1% |
| Maltese | 99.9 /100 | #43 | Exceptional 97.1% |
| Northern Europeans | 99.9 /100 | #44 | Exceptional 97.1% |
| Czechoslovakians | 99.9 /100 | #45 | Exceptional 97.1% |
| Aleuts | 99.9 /100 | #46 | Exceptional 97.1% |
| Bulgarians | 99.9 /100 | #47 | Exceptional 97.1% |
| Celtics | 99.9 /100 | #48 | Exceptional 97.1% |
| Slavs | 99.9 /100 | #49 | Exceptional 97.1% |
| Immigrants | Scotland | 99.9 /100 | #50 | Exceptional 97.1% |
| Estonians | 99.9 /100 | #51 | Exceptional 97.0% |
| Greeks | 99.9 /100 | #52 | Exceptional 97.0% |
| Austrians | 99.8 /100 | #53 | Exceptional 97.0% |
| Australians | 99.8 /100 | #54 | Exceptional 97.0% |
| Russians | 99.8 /100 | #55 | Exceptional 97.0% |