Central American vs Celtic 7th Grade
COMPARE
Central American
Celtic
7th Grade
7th Grade Comparison
Central Americans
Celtics
92.1%
7TH GRADE
0.0/ 100
METRIC RATING
338th/ 347
METRIC RANK
97.1%
7TH GRADE
99.9/ 100
METRIC RATING
48th/ 347
METRIC RANK
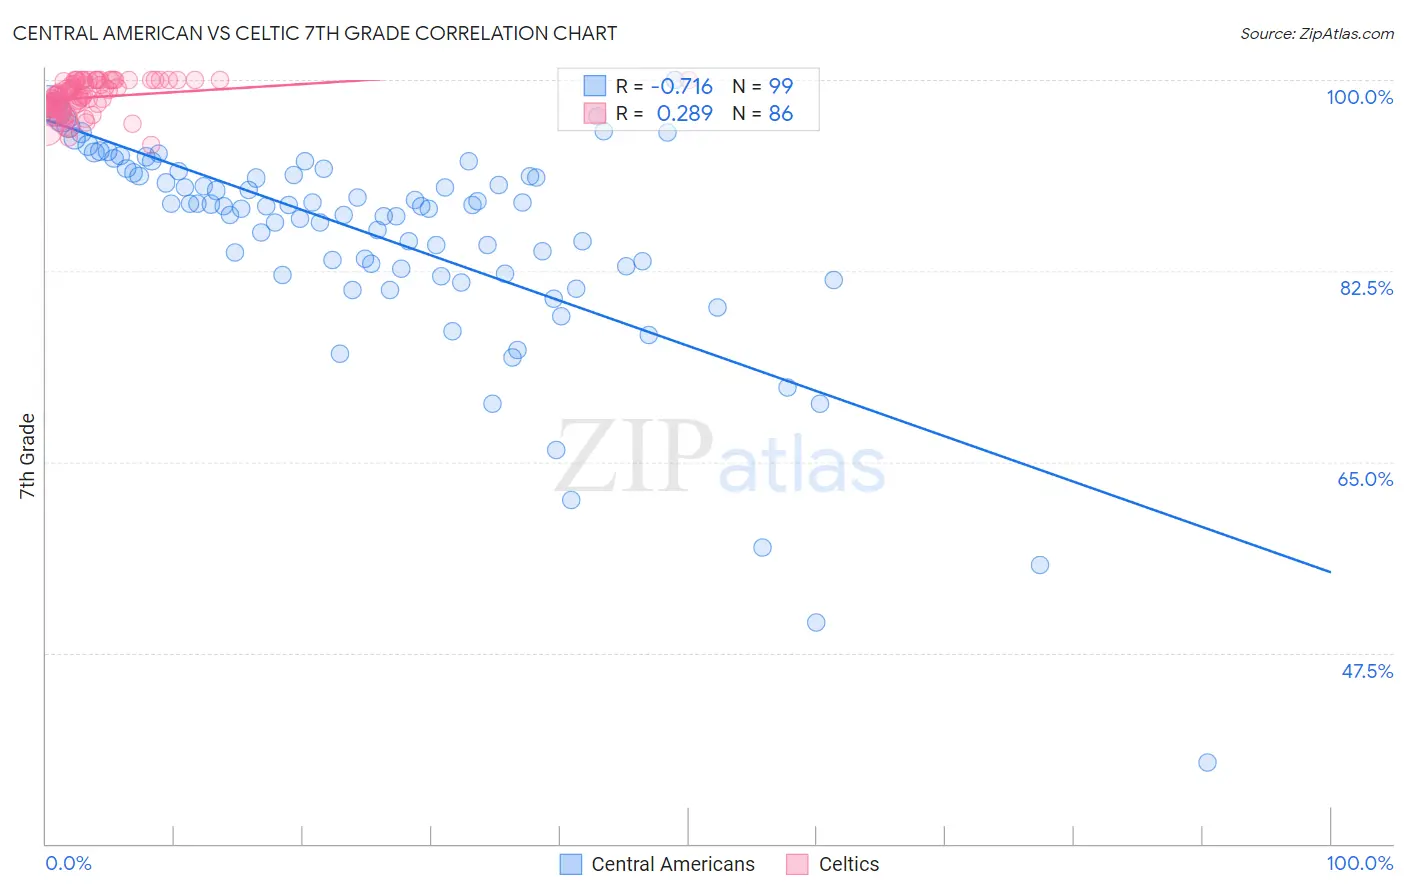
Central American vs Celtic 7th Grade Correlation Chart
The statistical analysis conducted on geographies consisting of 504,619,347 people shows a strong negative correlation between the proportion of Central Americans and percentage of population with at least 7th grade education in the United States with a correlation coefficient (R) of -0.716 and weighted average of 92.1%. Similarly, the statistical analysis conducted on geographies consisting of 168,875,339 people shows a weak positive correlation between the proportion of Celtics and percentage of population with at least 7th grade education in the United States with a correlation coefficient (R) of 0.289 and weighted average of 97.1%, a difference of 5.4%.
7th Grade Correlation Summary
| Measurement | Central American | Celtic |
| Minimum | 37.5% | 94.0% |
| Maximum | 100.0% | 100.0% |
| Range | 62.5% | 6.0% |
| Mean | 85.5% | 98.4% |
| Median | 88.4% | 98.6% |
| Interquartile 25% (IQ1) | 82.2% | 97.4% |
| Interquartile 75% (IQ3) | 91.5% | 100.0% |
| Interquartile Range (IQR) | 9.3% | 2.6% |
| Standard Deviation (Sample) | 10.2% | 1.5% |
| Standard Deviation (Population) | 10.1% | 1.5% |
Similar Demographics by 7th Grade
Demographics Similar to Central Americans by 7th Grade
In terms of 7th grade, the demographic groups most similar to Central Americans are Immigrants from Latin America (92.2%, a difference of 0.13%), Mexican (91.9%, a difference of 0.25%), Immigrants from Honduras (92.5%, a difference of 0.40%), Yakama (91.7%, a difference of 0.44%), and Guatemalan (91.7%, a difference of 0.46%).
| Demographics | Rating | Rank | 7th Grade |
| Hondurans | 0.0 /100 | #331 | Tragic 92.9% |
| Hispanics or Latinos | 0.0 /100 | #332 | Tragic 92.7% |
| Immigrants | Armenia | 0.0 /100 | #333 | Tragic 92.7% |
| Immigrants | Yemen | 0.0 /100 | #334 | Tragic 92.6% |
| Mexican American Indians | 0.0 /100 | #335 | Tragic 92.6% |
| Immigrants | Honduras | 0.0 /100 | #336 | Tragic 92.5% |
| Immigrants | Latin America | 0.0 /100 | #337 | Tragic 92.2% |
| Central Americans | 0.0 /100 | #338 | Tragic 92.1% |
| Mexicans | 0.0 /100 | #339 | Tragic 91.9% |
| Yakama | 0.0 /100 | #340 | Tragic 91.7% |
| Guatemalans | 0.0 /100 | #341 | Tragic 91.7% |
| Salvadorans | 0.0 /100 | #342 | Tragic 91.5% |
| Immigrants | Guatemala | 0.0 /100 | #343 | Tragic 91.3% |
| Immigrants | Central America | 0.0 /100 | #344 | Tragic 91.0% |
| Immigrants | El Salvador | 0.0 /100 | #345 | Tragic 90.9% |
Demographics Similar to Celtics by 7th Grade
In terms of 7th grade, the demographic groups most similar to Celtics are Bulgarian (97.1%, a difference of 0.010%), Slavic (97.1%, a difference of 0.010%), Immigrants from Scotland (97.1%, a difference of 0.010%), Czechoslovakian (97.1%, a difference of 0.030%), and Aleut (97.1%, a difference of 0.030%).
| Demographics | Rating | Rank | 7th Grade |
| Eastern Europeans | 100.0 /100 | #41 | Exceptional 97.2% |
| Chinese | 99.9 /100 | #42 | Exceptional 97.1% |
| Maltese | 99.9 /100 | #43 | Exceptional 97.1% |
| Northern Europeans | 99.9 /100 | #44 | Exceptional 97.1% |
| Czechoslovakians | 99.9 /100 | #45 | Exceptional 97.1% |
| Aleuts | 99.9 /100 | #46 | Exceptional 97.1% |
| Bulgarians | 99.9 /100 | #47 | Exceptional 97.1% |
| Celtics | 99.9 /100 | #48 | Exceptional 97.1% |
| Slavs | 99.9 /100 | #49 | Exceptional 97.1% |
| Immigrants | Scotland | 99.9 /100 | #50 | Exceptional 97.1% |
| Estonians | 99.9 /100 | #51 | Exceptional 97.0% |
| Greeks | 99.9 /100 | #52 | Exceptional 97.0% |
| Austrians | 99.8 /100 | #53 | Exceptional 97.0% |
| Australians | 99.8 /100 | #54 | Exceptional 97.0% |
| Russians | 99.8 /100 | #55 | Exceptional 97.0% |