Creek vs Immigrants from England 5th Grade
COMPARE
Creek
Immigrants from England
5th Grade
5th Grade Comparison
Creek
Immigrants from England
98.0%
5TH GRADE
99.8/ 100
METRIC RATING
55th/ 347
METRIC RANK
97.8%
5TH GRADE
99.3/ 100
METRIC RATING
77th/ 347
METRIC RANK
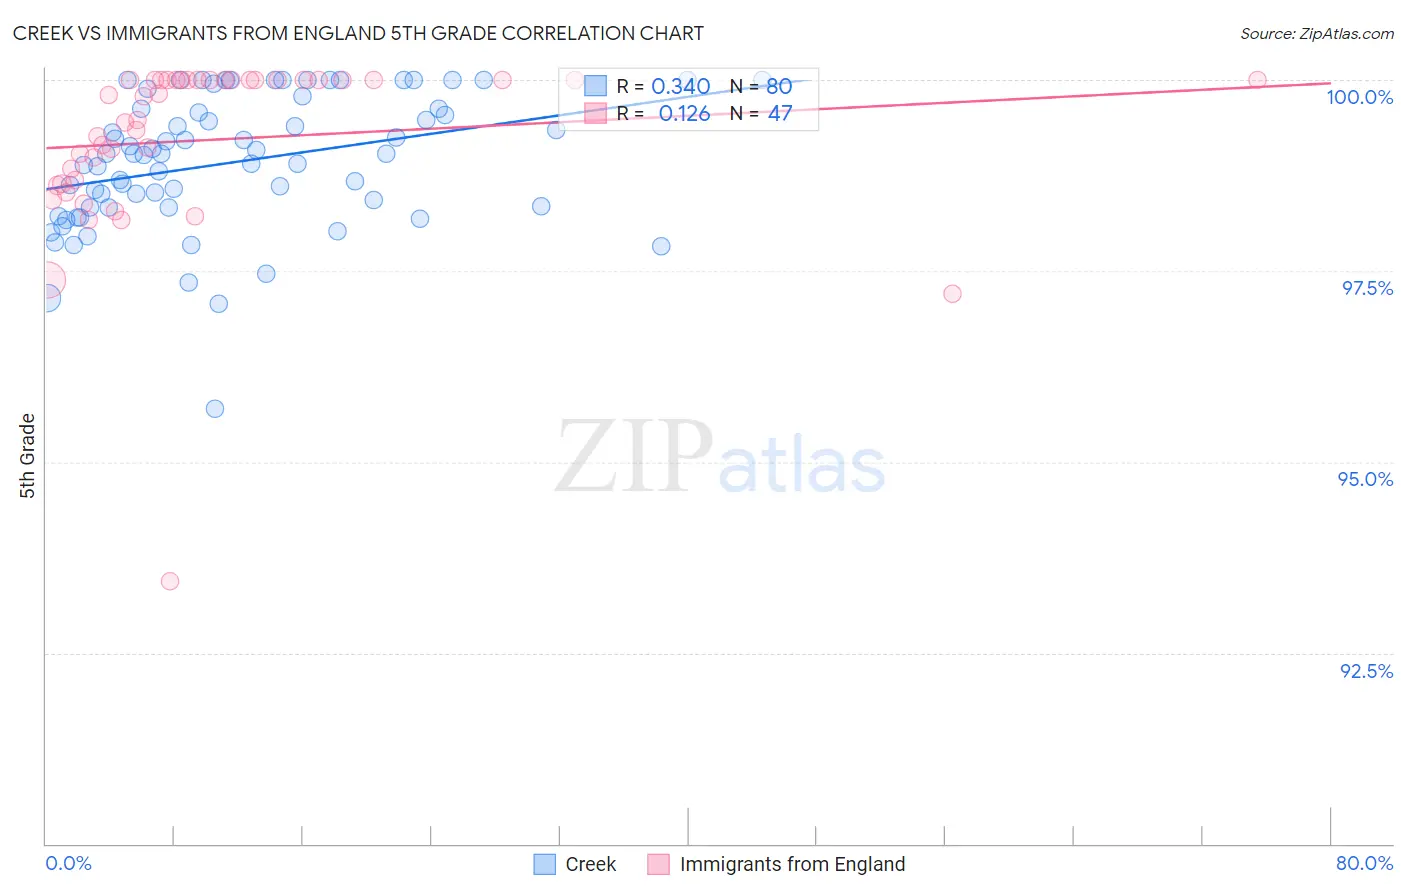
Creek vs Immigrants from England 5th Grade Correlation Chart
The statistical analysis conducted on geographies consisting of 178,480,663 people shows a mild positive correlation between the proportion of Creek and percentage of population with at least 5th grade education in the United States with a correlation coefficient (R) of 0.340 and weighted average of 98.0%. Similarly, the statistical analysis conducted on geographies consisting of 391,898,018 people shows a poor positive correlation between the proportion of Immigrants from England and percentage of population with at least 5th grade education in the United States with a correlation coefficient (R) of 0.126 and weighted average of 97.8%, a difference of 0.12%.
5th Grade Correlation Summary
| Measurement | Creek | Immigrants from England |
| Minimum | 95.7% | 93.4% |
| Maximum | 100.0% | 100.0% |
| Range | 4.3% | 6.6% |
| Mean | 98.9% | 99.2% |
| Median | 99.0% | 99.8% |
| Interquartile 25% (IQ1) | 98.3% | 98.6% |
| Interquartile 75% (IQ3) | 99.6% | 100.0% |
| Interquartile Range (IQR) | 1.3% | 1.4% |
| Standard Deviation (Sample) | 0.87% | 1.2% |
| Standard Deviation (Population) | 0.87% | 1.1% |
Similar Demographics by 5th Grade
Demographics Similar to Creek by 5th Grade
In terms of 5th grade, the demographic groups most similar to Creek are Greek (97.9%, a difference of 0.0%), Austrian (97.9%, a difference of 0.0%), Slavic (98.0%, a difference of 0.010%), Australian (98.0%, a difference of 0.010%), and White/Caucasian (97.9%, a difference of 0.010%).
| Demographics | Rating | Rank | 5th Grade |
| Bulgarians | 99.8 /100 | #48 | Exceptional 98.0% |
| Estonians | 99.8 /100 | #49 | Exceptional 98.0% |
| Immigrants | Scotland | 99.8 /100 | #50 | Exceptional 98.0% |
| Celtics | 99.8 /100 | #51 | Exceptional 98.0% |
| Maltese | 99.8 /100 | #52 | Exceptional 98.0% |
| Slavs | 99.8 /100 | #53 | Exceptional 98.0% |
| Australians | 99.8 /100 | #54 | Exceptional 98.0% |
| Creek | 99.8 /100 | #55 | Exceptional 98.0% |
| Greeks | 99.8 /100 | #56 | Exceptional 97.9% |
| Austrians | 99.8 /100 | #57 | Exceptional 97.9% |
| Whites/Caucasians | 99.8 /100 | #58 | Exceptional 97.9% |
| Americans | 99.7 /100 | #59 | Exceptional 97.9% |
| Immigrants | Canada | 99.7 /100 | #60 | Exceptional 97.9% |
| Serbians | 99.7 /100 | #61 | Exceptional 97.9% |
| Immigrants | North America | 99.7 /100 | #62 | Exceptional 97.9% |
Demographics Similar to Immigrants from England by 5th Grade
In terms of 5th grade, the demographic groups most similar to Immigrants from England are Ukrainian (97.8%, a difference of 0.0%), Immigrants from Netherlands (97.8%, a difference of 0.0%), Cherokee (97.8%, a difference of 0.010%), Lumbee (97.8%, a difference of 0.010%), and Osage (97.8%, a difference of 0.010%).
| Demographics | Rating | Rank | 5th Grade |
| Iranians | 99.5 /100 | #70 | Exceptional 97.9% |
| Chickasaw | 99.5 /100 | #71 | Exceptional 97.9% |
| Macedonians | 99.4 /100 | #72 | Exceptional 97.9% |
| Cherokee | 99.4 /100 | #73 | Exceptional 97.8% |
| Lumbee | 99.3 /100 | #74 | Exceptional 97.8% |
| Ukrainians | 99.3 /100 | #75 | Exceptional 97.8% |
| Immigrants | Netherlands | 99.3 /100 | #76 | Exceptional 97.8% |
| Immigrants | England | 99.3 /100 | #77 | Exceptional 97.8% |
| Osage | 99.3 /100 | #78 | Exceptional 97.8% |
| Immigrants | Lithuania | 99.2 /100 | #79 | Exceptional 97.8% |
| Immigrants | India | 99.2 /100 | #80 | Exceptional 97.8% |
| Icelanders | 99.2 /100 | #81 | Exceptional 97.8% |
| Pueblo | 99.2 /100 | #82 | Exceptional 97.8% |
| Zimbabweans | 99.0 /100 | #83 | Exceptional 97.8% |
| Potawatomi | 99.0 /100 | #84 | Exceptional 97.8% |