Creek vs French 3rd Grade
COMPARE
Creek
French
3rd Grade
3rd Grade Comparison
Creek
French
98.2%
3RD GRADE
99.7/ 100
METRIC RATING
60th/ 347
METRIC RANK
98.4%
3RD GRADE
100.0/ 100
METRIC RATING
28th/ 347
METRIC RANK
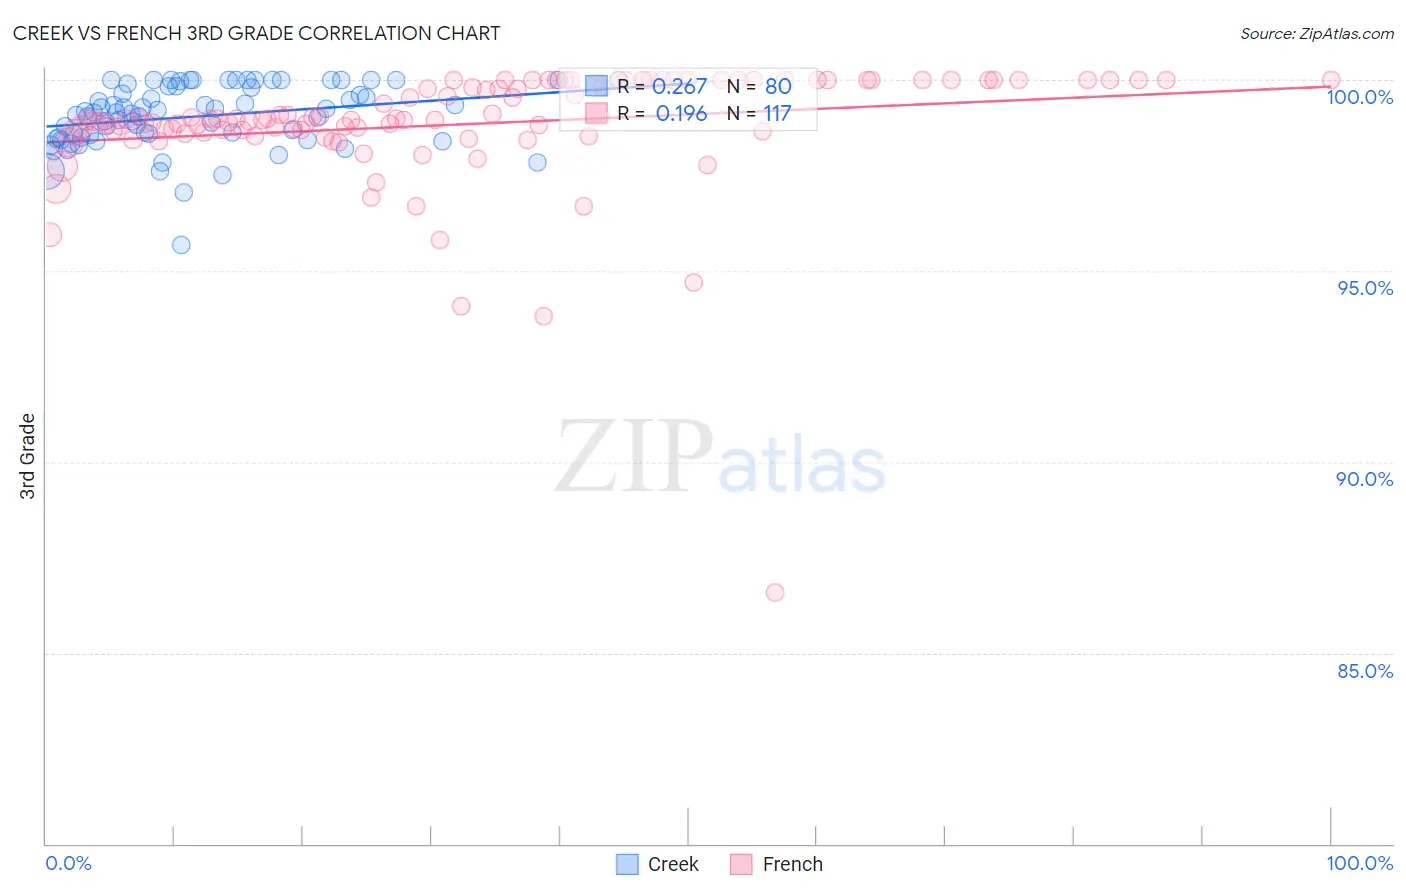
Creek vs French 3rd Grade Correlation Chart
The statistical analysis conducted on geographies consisting of 178,480,663 people shows a weak positive correlation between the proportion of Creek and percentage of population with at least 3rd grade education in the United States with a correlation coefficient (R) of 0.267 and weighted average of 98.2%. Similarly, the statistical analysis conducted on geographies consisting of 572,427,269 people shows a poor positive correlation between the proportion of French and percentage of population with at least 3rd grade education in the United States with a correlation coefficient (R) of 0.196 and weighted average of 98.4%, a difference of 0.20%.
3rd Grade Correlation Summary
| Measurement | Creek | French |
| Minimum | 95.7% | 86.6% |
| Maximum | 100.0% | 100.0% |
| Range | 4.3% | 13.4% |
| Mean | 99.0% | 98.8% |
| Median | 99.1% | 99.0% |
| Interquartile 25% (IQ1) | 98.5% | 98.6% |
| Interquartile 75% (IQ3) | 99.8% | 100.0% |
| Interquartile Range (IQR) | 1.3% | 1.4% |
| Standard Deviation (Sample) | 0.83% | 1.6% |
| Standard Deviation (Population) | 0.82% | 1.6% |
Similar Demographics by 3rd Grade
Demographics Similar to Creek by 3rd Grade
In terms of 3rd grade, the demographic groups most similar to Creek are Slavic (98.3%, a difference of 0.0%), Greek (98.3%, a difference of 0.0%), Maltese (98.3%, a difference of 0.0%), Bulgarian (98.3%, a difference of 0.010%), and American (98.3%, a difference of 0.010%).
| Demographics | Rating | Rank | 3rd Grade |
| Immigrants | Scotland | 99.8 /100 | #53 | Exceptional 98.3% |
| Bulgarians | 99.8 /100 | #54 | Exceptional 98.3% |
| Americans | 99.8 /100 | #55 | Exceptional 98.3% |
| Austrians | 99.8 /100 | #56 | Exceptional 98.3% |
| Slavs | 99.7 /100 | #57 | Exceptional 98.3% |
| Greeks | 99.7 /100 | #58 | Exceptional 98.3% |
| Maltese | 99.7 /100 | #59 | Exceptional 98.3% |
| Creek | 99.7 /100 | #60 | Exceptional 98.2% |
| Pueblo | 99.7 /100 | #61 | Exceptional 98.2% |
| Immigrants | Canada | 99.7 /100 | #62 | Exceptional 98.2% |
| Immigrants | North America | 99.7 /100 | #63 | Exceptional 98.2% |
| Kiowa | 99.6 /100 | #64 | Exceptional 98.2% |
| New Zealanders | 99.6 /100 | #65 | Exceptional 98.2% |
| Serbians | 99.6 /100 | #66 | Exceptional 98.2% |
| Russians | 99.6 /100 | #67 | Exceptional 98.2% |
Demographics Similar to French by 3rd Grade
In terms of 3rd grade, the demographic groups most similar to French are Croatian (98.5%, a difference of 0.010%), French Canadian (98.4%, a difference of 0.010%), European (98.4%, a difference of 0.010%), Czech (98.4%, a difference of 0.010%), and Scotch-Irish (98.5%, a difference of 0.020%).
| Demographics | Rating | Rank | 3rd Grade |
| Lithuanians | 100.0 /100 | #21 | Exceptional 98.5% |
| Finns | 100.0 /100 | #22 | Exceptional 98.5% |
| Sioux | 100.0 /100 | #23 | Exceptional 98.5% |
| Danes | 100.0 /100 | #24 | Exceptional 98.5% |
| Scotch-Irish | 100.0 /100 | #25 | Exceptional 98.5% |
| Aleuts | 100.0 /100 | #26 | Exceptional 98.5% |
| Croatians | 100.0 /100 | #27 | Exceptional 98.5% |
| French | 100.0 /100 | #28 | Exceptional 98.4% |
| French Canadians | 100.0 /100 | #29 | Exceptional 98.4% |
| Europeans | 100.0 /100 | #30 | Exceptional 98.4% |
| Czechs | 100.0 /100 | #31 | Exceptional 98.4% |
| Scandinavians | 100.0 /100 | #32 | Exceptional 98.4% |
| Chinese | 100.0 /100 | #33 | Exceptional 98.4% |
| Swiss | 100.0 /100 | #34 | Exceptional 98.4% |
| Arapaho | 100.0 /100 | #35 | Exceptional 98.4% |