Sri Lankan vs French 3rd Grade
COMPARE
Sri Lankan
French
3rd Grade
3rd Grade Comparison
Sri Lankans
French
96.7%
3RD GRADE
0.0/ 100
METRIC RATING
309th/ 347
METRIC RANK
98.4%
3RD GRADE
100.0/ 100
METRIC RATING
28th/ 347
METRIC RANK
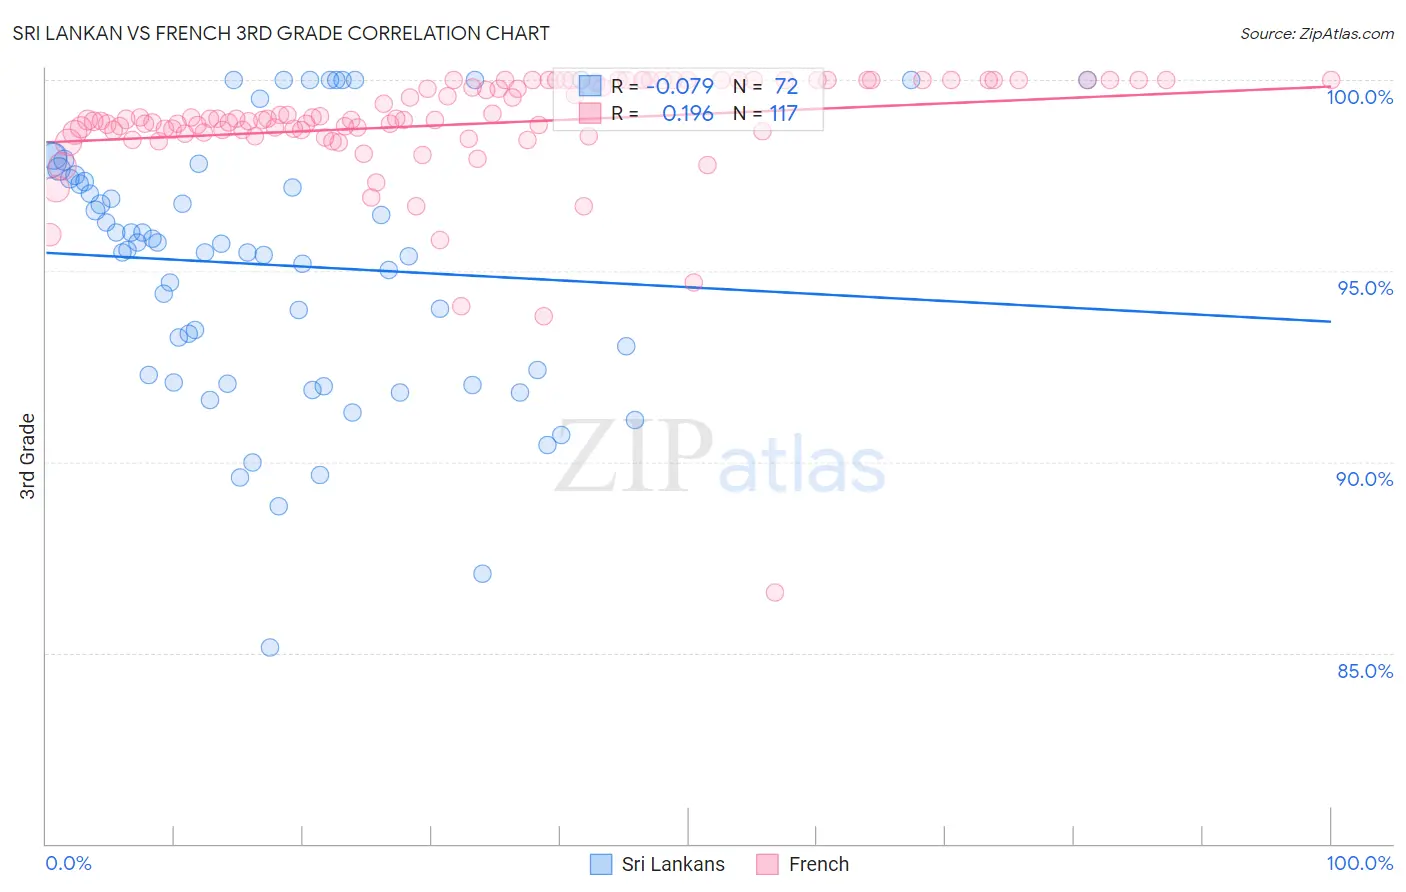
Sri Lankan vs French 3rd Grade Correlation Chart
The statistical analysis conducted on geographies consisting of 440,593,746 people shows a slight negative correlation between the proportion of Sri Lankans and percentage of population with at least 3rd grade education in the United States with a correlation coefficient (R) of -0.079 and weighted average of 96.7%. Similarly, the statistical analysis conducted on geographies consisting of 572,427,269 people shows a poor positive correlation between the proportion of French and percentage of population with at least 3rd grade education in the United States with a correlation coefficient (R) of 0.196 and weighted average of 98.4%, a difference of 1.8%.
3rd Grade Correlation Summary
| Measurement | Sri Lankan | French |
| Minimum | 85.2% | 86.6% |
| Maximum | 100.0% | 100.0% |
| Range | 14.8% | 13.4% |
| Mean | 95.1% | 98.8% |
| Median | 95.6% | 99.0% |
| Interquartile 25% (IQ1) | 92.2% | 98.6% |
| Interquartile 75% (IQ3) | 97.5% | 100.0% |
| Interquartile Range (IQR) | 5.3% | 1.4% |
| Standard Deviation (Sample) | 3.4% | 1.6% |
| Standard Deviation (Population) | 3.4% | 1.6% |
Similar Demographics by 3rd Grade
Demographics Similar to Sri Lankans by 3rd Grade
In terms of 3rd grade, the demographic groups most similar to Sri Lankans are Nicaraguan (96.7%, a difference of 0.0%), Immigrants from Haiti (96.7%, a difference of 0.0%), Guyanese (96.7%, a difference of 0.020%), Cape Verdean (96.6%, a difference of 0.030%), and Central American Indian (96.7%, a difference of 0.050%).
| Demographics | Rating | Rank | 3rd Grade |
| Immigrants | Somalia | 0.0 /100 | #302 | Tragic 96.8% |
| Ecuadorians | 0.0 /100 | #303 | Tragic 96.7% |
| Immigrants | Caribbean | 0.0 /100 | #304 | Tragic 96.7% |
| Central American Indians | 0.0 /100 | #305 | Tragic 96.7% |
| Guyanese | 0.0 /100 | #306 | Tragic 96.7% |
| Nicaraguans | 0.0 /100 | #307 | Tragic 96.7% |
| Immigrants | Haiti | 0.0 /100 | #308 | Tragic 96.7% |
| Sri Lankans | 0.0 /100 | #309 | Tragic 96.7% |
| Cape Verdeans | 0.0 /100 | #310 | Tragic 96.6% |
| Immigrants | Guyana | 0.0 /100 | #311 | Tragic 96.6% |
| Immigrants | Laos | 0.0 /100 | #312 | Tragic 96.6% |
| Immigrants | Ecuador | 0.0 /100 | #313 | Tragic 96.6% |
| Belizeans | 0.0 /100 | #314 | Tragic 96.6% |
| Immigrants | Azores | 0.0 /100 | #315 | Tragic 96.6% |
| Immigrants | Burma/Myanmar | 0.0 /100 | #316 | Tragic 96.6% |
Demographics Similar to French by 3rd Grade
In terms of 3rd grade, the demographic groups most similar to French are Croatian (98.5%, a difference of 0.010%), French Canadian (98.4%, a difference of 0.010%), European (98.4%, a difference of 0.010%), Czech (98.4%, a difference of 0.010%), and Scotch-Irish (98.5%, a difference of 0.020%).
| Demographics | Rating | Rank | 3rd Grade |
| Lithuanians | 100.0 /100 | #21 | Exceptional 98.5% |
| Finns | 100.0 /100 | #22 | Exceptional 98.5% |
| Sioux | 100.0 /100 | #23 | Exceptional 98.5% |
| Danes | 100.0 /100 | #24 | Exceptional 98.5% |
| Scotch-Irish | 100.0 /100 | #25 | Exceptional 98.5% |
| Aleuts | 100.0 /100 | #26 | Exceptional 98.5% |
| Croatians | 100.0 /100 | #27 | Exceptional 98.5% |
| French | 100.0 /100 | #28 | Exceptional 98.4% |
| French Canadians | 100.0 /100 | #29 | Exceptional 98.4% |
| Europeans | 100.0 /100 | #30 | Exceptional 98.4% |
| Czechs | 100.0 /100 | #31 | Exceptional 98.4% |
| Scandinavians | 100.0 /100 | #32 | Exceptional 98.4% |
| Chinese | 100.0 /100 | #33 | Exceptional 98.4% |
| Swiss | 100.0 /100 | #34 | Exceptional 98.4% |
| Arapaho | 100.0 /100 | #35 | Exceptional 98.4% |