Cree vs Pima 8th Grade
COMPARE
Cree
Pima
8th Grade
8th Grade Comparison
Cree
Pima
96.4%
8TH GRADE
98.6/ 100
METRIC RATING
99th/ 347
METRIC RANK
95.6%
8TH GRADE
28.6/ 100
METRIC RATING
192nd/ 347
METRIC RANK
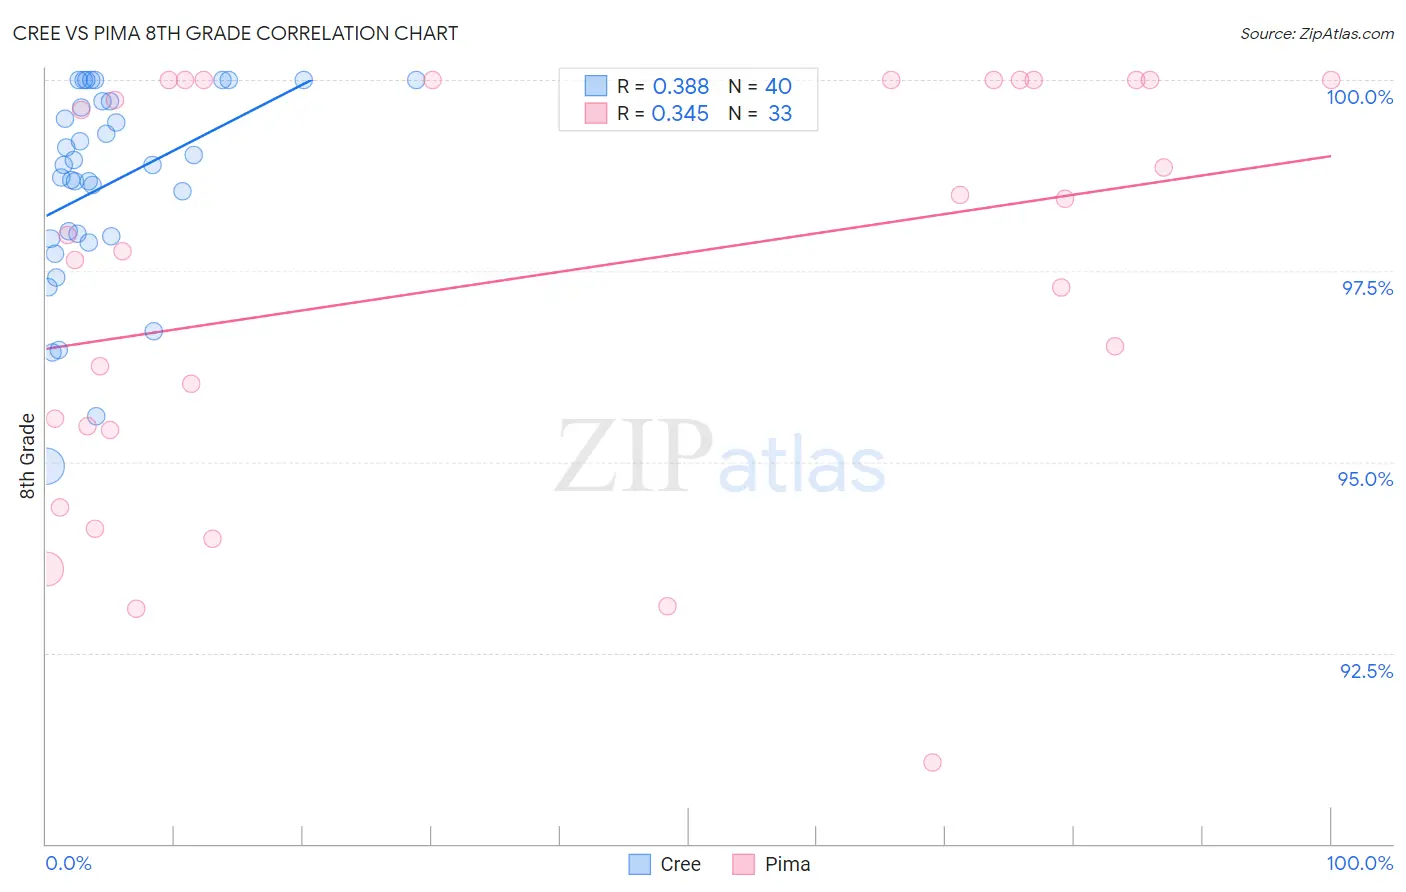
Cree vs Pima 8th Grade Correlation Chart
The statistical analysis conducted on geographies consisting of 76,204,399 people shows a mild positive correlation between the proportion of Cree and percentage of population with at least 8th grade education in the United States with a correlation coefficient (R) of 0.388 and weighted average of 96.4%. Similarly, the statistical analysis conducted on geographies consisting of 61,552,136 people shows a mild positive correlation between the proportion of Pima and percentage of population with at least 8th grade education in the United States with a correlation coefficient (R) of 0.345 and weighted average of 95.6%, a difference of 0.84%.
8th Grade Correlation Summary
| Measurement | Cree | Pima |
| Minimum | 94.9% | 91.1% |
| Maximum | 100.0% | 100.0% |
| Range | 5.1% | 8.9% |
| Mean | 98.6% | 97.4% |
| Median | 98.9% | 98.0% |
| Interquartile 25% (IQ1) | 97.9% | 95.4% |
| Interquartile 75% (IQ3) | 99.7% | 100.0% |
| Interquartile Range (IQR) | 1.8% | 4.6% |
| Standard Deviation (Sample) | 1.3% | 2.7% |
| Standard Deviation (Population) | 1.3% | 2.6% |
Similar Demographics by 8th Grade
Demographics Similar to Cree by 8th Grade
In terms of 8th grade, the demographic groups most similar to Cree are Osage (96.4%, a difference of 0.0%), Immigrants from Germany (96.4%, a difference of 0.0%), Potawatomi (96.4%, a difference of 0.010%), Immigrants from Czechoslovakia (96.4%, a difference of 0.010%), and Immigrants from Singapore (96.4%, a difference of 0.020%).
| Demographics | Rating | Rank | 8th Grade |
| Menominee | 98.9 /100 | #92 | Exceptional 96.4% |
| Immigrants | Denmark | 98.8 /100 | #93 | Exceptional 96.4% |
| Immigrants | Singapore | 98.8 /100 | #94 | Exceptional 96.4% |
| German Russians | 98.8 /100 | #95 | Exceptional 96.4% |
| Potawatomi | 98.7 /100 | #96 | Exceptional 96.4% |
| Osage | 98.7 /100 | #97 | Exceptional 96.4% |
| Immigrants | Germany | 98.7 /100 | #98 | Exceptional 96.4% |
| Cree | 98.6 /100 | #99 | Exceptional 96.4% |
| Immigrants | Czechoslovakia | 98.6 /100 | #100 | Exceptional 96.4% |
| Bhutanese | 98.2 /100 | #101 | Exceptional 96.4% |
| South Africans | 98.2 /100 | #102 | Exceptional 96.4% |
| Immigrants | Saudi Arabia | 98.0 /100 | #103 | Exceptional 96.3% |
| Kiowa | 98.0 /100 | #104 | Exceptional 96.3% |
| Immigrants | North Macedonia | 98.0 /100 | #105 | Exceptional 96.3% |
| Okinawans | 98.0 /100 | #106 | Exceptional 96.3% |
Demographics Similar to Pima by 8th Grade
In terms of 8th grade, the demographic groups most similar to Pima are Panamanian (95.6%, a difference of 0.0%), Immigrants from Nepal (95.6%, a difference of 0.010%), Immigrants from Micronesia (95.6%, a difference of 0.020%), Immigrants from Venezuela (95.6%, a difference of 0.020%), and Guamanian/Chamorro (95.6%, a difference of 0.020%).
| Demographics | Rating | Rank | 8th Grade |
| Blacks/African Americans | 34.8 /100 | #185 | Fair 95.6% |
| Brazilians | 34.8 /100 | #186 | Fair 95.6% |
| Sudanese | 33.0 /100 | #187 | Fair 95.6% |
| Liberians | 32.4 /100 | #188 | Fair 95.6% |
| Immigrants | Micronesia | 31.6 /100 | #189 | Fair 95.6% |
| Immigrants | Venezuela | 30.8 /100 | #190 | Fair 95.6% |
| Immigrants | Nepal | 30.2 /100 | #191 | Fair 95.6% |
| Pima | 28.6 /100 | #192 | Fair 95.6% |
| Panamanians | 28.4 /100 | #193 | Fair 95.6% |
| Guamanians/Chamorros | 26.6 /100 | #194 | Fair 95.6% |
| Immigrants | Zaire | 25.2 /100 | #195 | Fair 95.6% |
| Assyrians/Chaldeans/Syriacs | 24.5 /100 | #196 | Fair 95.6% |
| Sierra Leoneans | 24.3 /100 | #197 | Fair 95.6% |
| Paraguayans | 22.6 /100 | #198 | Fair 95.5% |
| Immigrants | Northern Africa | 22.5 /100 | #199 | Fair 95.5% |