Cree vs Yup'ik 8th Grade
COMPARE
Cree
Yup'ik
8th Grade
8th Grade Comparison
Cree
Yup'ik
96.4%
8TH GRADE
98.6/ 100
METRIC RATING
99th/ 347
METRIC RANK
97.0%
8TH GRADE
100.0/ 100
METRIC RATING
32nd/ 347
METRIC RANK
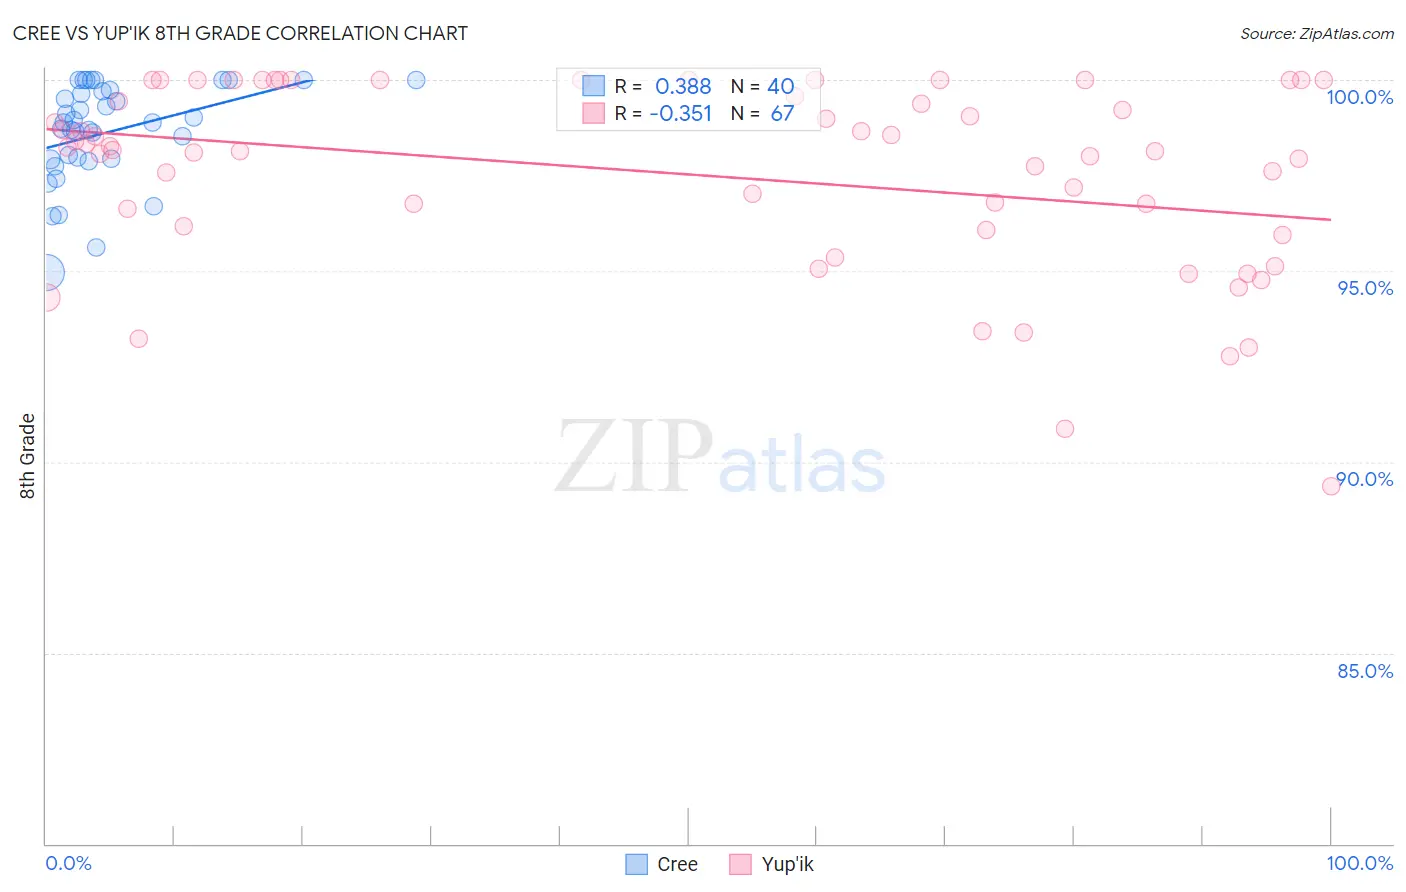
Cree vs Yup'ik 8th Grade Correlation Chart
The statistical analysis conducted on geographies consisting of 76,204,399 people shows a mild positive correlation between the proportion of Cree and percentage of population with at least 8th grade education in the United States with a correlation coefficient (R) of 0.388 and weighted average of 96.4%. Similarly, the statistical analysis conducted on geographies consisting of 39,963,824 people shows a mild negative correlation between the proportion of Yup'ik and percentage of population with at least 8th grade education in the United States with a correlation coefficient (R) of -0.351 and weighted average of 97.0%, a difference of 0.67%.
8th Grade Correlation Summary
| Measurement | Cree | Yup'ik |
| Minimum | 94.9% | 89.4% |
| Maximum | 100.0% | 100.0% |
| Range | 5.1% | 10.6% |
| Mean | 98.6% | 97.5% |
| Median | 98.9% | 98.2% |
| Interquartile 25% (IQ1) | 97.9% | 96.1% |
| Interquartile 75% (IQ3) | 99.7% | 100.0% |
| Interquartile Range (IQR) | 1.8% | 3.9% |
| Standard Deviation (Sample) | 1.3% | 2.5% |
| Standard Deviation (Population) | 1.3% | 2.5% |
Similar Demographics by 8th Grade
Demographics Similar to Cree by 8th Grade
In terms of 8th grade, the demographic groups most similar to Cree are Osage (96.4%, a difference of 0.0%), Immigrants from Germany (96.4%, a difference of 0.0%), Potawatomi (96.4%, a difference of 0.010%), Immigrants from Czechoslovakia (96.4%, a difference of 0.010%), and Immigrants from Singapore (96.4%, a difference of 0.020%).
| Demographics | Rating | Rank | 8th Grade |
| Menominee | 98.9 /100 | #92 | Exceptional 96.4% |
| Immigrants | Denmark | 98.8 /100 | #93 | Exceptional 96.4% |
| Immigrants | Singapore | 98.8 /100 | #94 | Exceptional 96.4% |
| German Russians | 98.8 /100 | #95 | Exceptional 96.4% |
| Potawatomi | 98.7 /100 | #96 | Exceptional 96.4% |
| Osage | 98.7 /100 | #97 | Exceptional 96.4% |
| Immigrants | Germany | 98.7 /100 | #98 | Exceptional 96.4% |
| Cree | 98.6 /100 | #99 | Exceptional 96.4% |
| Immigrants | Czechoslovakia | 98.6 /100 | #100 | Exceptional 96.4% |
| Bhutanese | 98.2 /100 | #101 | Exceptional 96.4% |
| South Africans | 98.2 /100 | #102 | Exceptional 96.4% |
| Immigrants | Saudi Arabia | 98.0 /100 | #103 | Exceptional 96.3% |
| Kiowa | 98.0 /100 | #104 | Exceptional 96.3% |
| Immigrants | North Macedonia | 98.0 /100 | #105 | Exceptional 96.3% |
| Okinawans | 98.0 /100 | #106 | Exceptional 96.3% |
Demographics Similar to Yup'ik by 8th Grade
In terms of 8th grade, the demographic groups most similar to Yup'ik are Swiss (97.0%, a difference of 0.010%), Sioux (97.1%, a difference of 0.030%), Chippewa (97.1%, a difference of 0.030%), Luxembourger (97.0%, a difference of 0.040%), and Alaska Native (97.0%, a difference of 0.050%).
| Demographics | Rating | Rank | 8th Grade |
| Czechs | 100.0 /100 | #25 | Exceptional 97.1% |
| French | 100.0 /100 | #26 | Exceptional 97.1% |
| Scotch-Irish | 100.0 /100 | #27 | Exceptional 97.1% |
| Italians | 100.0 /100 | #28 | Exceptional 97.1% |
| Europeans | 100.0 /100 | #29 | Exceptional 97.1% |
| Sioux | 100.0 /100 | #30 | Exceptional 97.1% |
| Chippewa | 100.0 /100 | #31 | Exceptional 97.1% |
| Yup'ik | 100.0 /100 | #32 | Exceptional 97.0% |
| Swiss | 100.0 /100 | #33 | Exceptional 97.0% |
| Luxembourgers | 100.0 /100 | #34 | Exceptional 97.0% |
| Alaska Natives | 100.0 /100 | #35 | Exceptional 97.0% |
| Belgians | 100.0 /100 | #36 | Exceptional 97.0% |
| Latvians | 100.0 /100 | #37 | Exceptional 97.0% |
| British | 100.0 /100 | #38 | Exceptional 97.0% |
| Hungarians | 100.0 /100 | #39 | Exceptional 97.0% |