South African vs Irish 3rd Grade
COMPARE
South African
Irish
3rd Grade
3rd Grade Comparison
South Africans
Irish
98.1%
3RD GRADE
98.2/ 100
METRIC RATING
97th/ 347
METRIC RANK
98.5%
3RD GRADE
100.0/ 100
METRIC RATING
18th/ 347
METRIC RANK
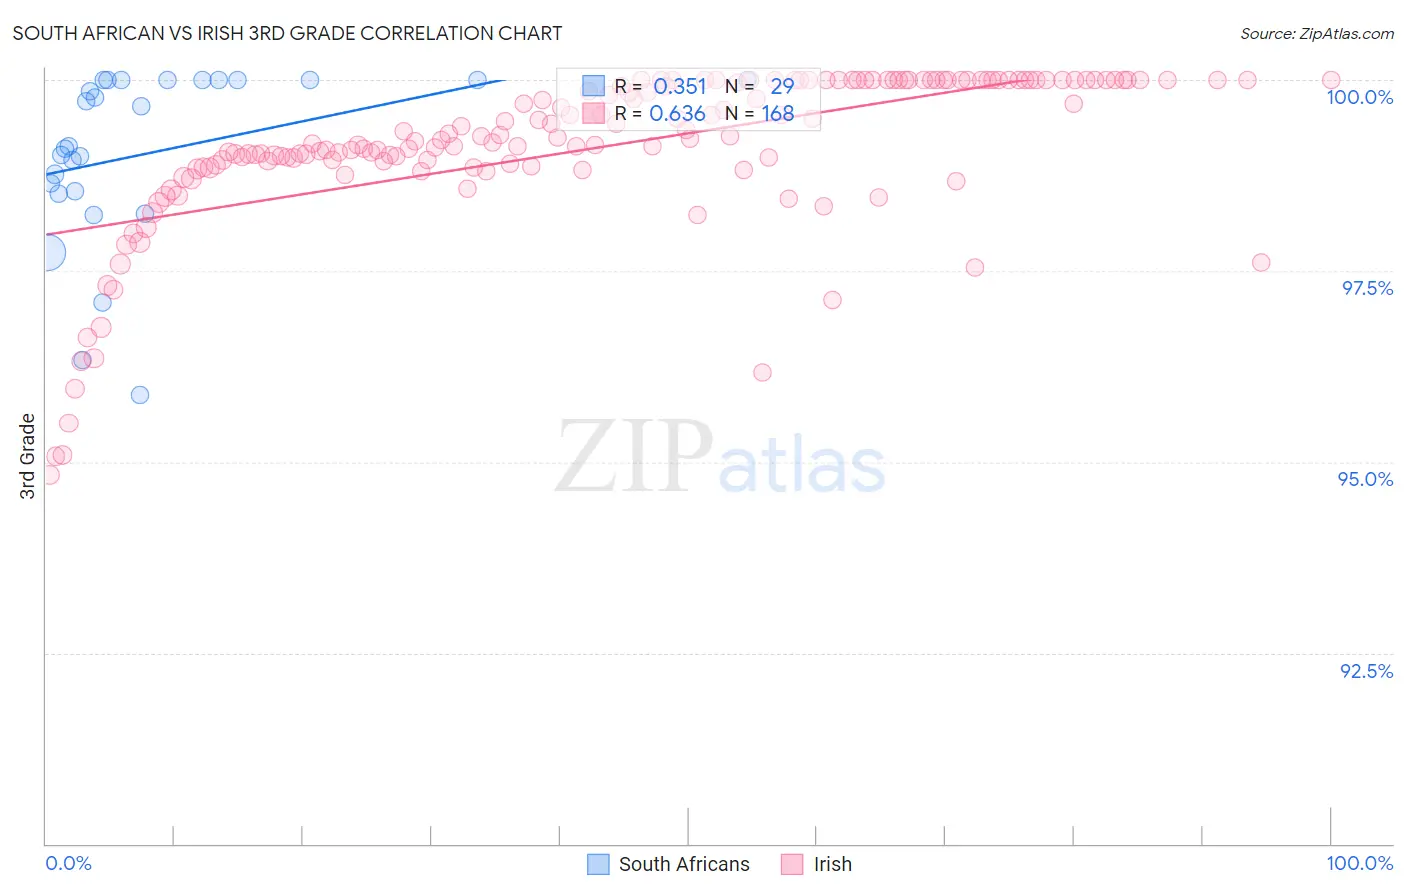
South African vs Irish 3rd Grade Correlation Chart
The statistical analysis conducted on geographies consisting of 182,604,532 people shows a mild positive correlation between the proportion of South Africans and percentage of population with at least 3rd grade education in the United States with a correlation coefficient (R) of 0.351 and weighted average of 98.1%. Similarly, the statistical analysis conducted on geographies consisting of 580,708,963 people shows a significant positive correlation between the proportion of Irish and percentage of population with at least 3rd grade education in the United States with a correlation coefficient (R) of 0.636 and weighted average of 98.5%, a difference of 0.42%.
3rd Grade Correlation Summary
| Measurement | South African | Irish |
| Minimum | 95.9% | 94.8% |
| Maximum | 100.0% | 100.0% |
| Range | 4.1% | 5.2% |
| Mean | 99.0% | 99.1% |
| Median | 99.1% | 99.2% |
| Interquartile 25% (IQ1) | 98.5% | 98.9% |
| Interquartile 75% (IQ3) | 100.0% | 100.0% |
| Interquartile Range (IQR) | 1.5% | 1.1% |
| Standard Deviation (Sample) | 1.1% | 1.1% |
| Standard Deviation (Population) | 1.1% | 1.1% |
Similar Demographics by 3rd Grade
Demographics Similar to South Africans by 3rd Grade
In terms of 3rd grade, the demographic groups most similar to South Africans are Immigrants from Ireland (98.1%, a difference of 0.0%), Immigrants from Germany (98.1%, a difference of 0.010%), Cypriot (98.1%, a difference of 0.010%), Choctaw (98.1%, a difference of 0.010%), and Romanian (98.1%, a difference of 0.010%).
| Demographics | Rating | Rank | 3rd Grade |
| Zimbabweans | 98.8 /100 | #90 | Exceptional 98.1% |
| Hopi | 98.7 /100 | #91 | Exceptional 98.1% |
| Immigrants | South Africa | 98.7 /100 | #92 | Exceptional 98.1% |
| Immigrants | Western Europe | 98.7 /100 | #93 | Exceptional 98.1% |
| Immigrants | Germany | 98.4 /100 | #94 | Exceptional 98.1% |
| Cypriots | 98.4 /100 | #95 | Exceptional 98.1% |
| Immigrants | Ireland | 98.2 /100 | #96 | Exceptional 98.1% |
| South Africans | 98.2 /100 | #97 | Exceptional 98.1% |
| Choctaw | 98.0 /100 | #98 | Exceptional 98.1% |
| Romanians | 98.0 /100 | #99 | Exceptional 98.1% |
| Cree | 97.9 /100 | #100 | Exceptional 98.1% |
| Puget Sound Salish | 97.9 /100 | #101 | Exceptional 98.1% |
| Immigrants | Nonimmigrants | 97.8 /100 | #102 | Exceptional 98.1% |
| Yugoslavians | 97.7 /100 | #103 | Exceptional 98.1% |
| Turks | 97.6 /100 | #104 | Exceptional 98.1% |
Demographics Similar to Irish by 3rd Grade
In terms of 3rd grade, the demographic groups most similar to Irish are Dutch (98.5%, a difference of 0.010%), Polish (98.5%, a difference of 0.010%), Pennsylvania German (98.5%, a difference of 0.010%), Lithuanian (98.5%, a difference of 0.010%), and Scottish (98.5%, a difference of 0.020%).
| Demographics | Rating | Rank | 3rd Grade |
| Slovenes | 100.0 /100 | #11 | Exceptional 98.6% |
| English | 100.0 /100 | #12 | Exceptional 98.6% |
| Tlingit-Haida | 100.0 /100 | #13 | Exceptional 98.5% |
| Carpatho Rusyns | 100.0 /100 | #14 | Exceptional 98.5% |
| Swedes | 100.0 /100 | #15 | Exceptional 98.5% |
| Scottish | 100.0 /100 | #16 | Exceptional 98.5% |
| Dutch | 100.0 /100 | #17 | Exceptional 98.5% |
| Irish | 100.0 /100 | #18 | Exceptional 98.5% |
| Poles | 100.0 /100 | #19 | Exceptional 98.5% |
| Pennsylvania Germans | 100.0 /100 | #20 | Exceptional 98.5% |
| Lithuanians | 100.0 /100 | #21 | Exceptional 98.5% |
| Finns | 100.0 /100 | #22 | Exceptional 98.5% |
| Sioux | 100.0 /100 | #23 | Exceptional 98.5% |
| Danes | 100.0 /100 | #24 | Exceptional 98.5% |
| Scotch-Irish | 100.0 /100 | #25 | Exceptional 98.5% |