Tsimshian vs Immigrants from Kuwait Bachelor's Degree
COMPARE
Tsimshian
Immigrants from Kuwait
Bachelor's Degree
Bachelor's Degree Comparison
Tsimshian
Immigrants from Kuwait
28.8%
BACHELOR'S DEGREE
0.0/ 100
METRIC RATING
322nd/ 347
METRIC RANK
44.6%
BACHELOR'S DEGREE
99.9/ 100
METRIC RATING
45th/ 347
METRIC RANK
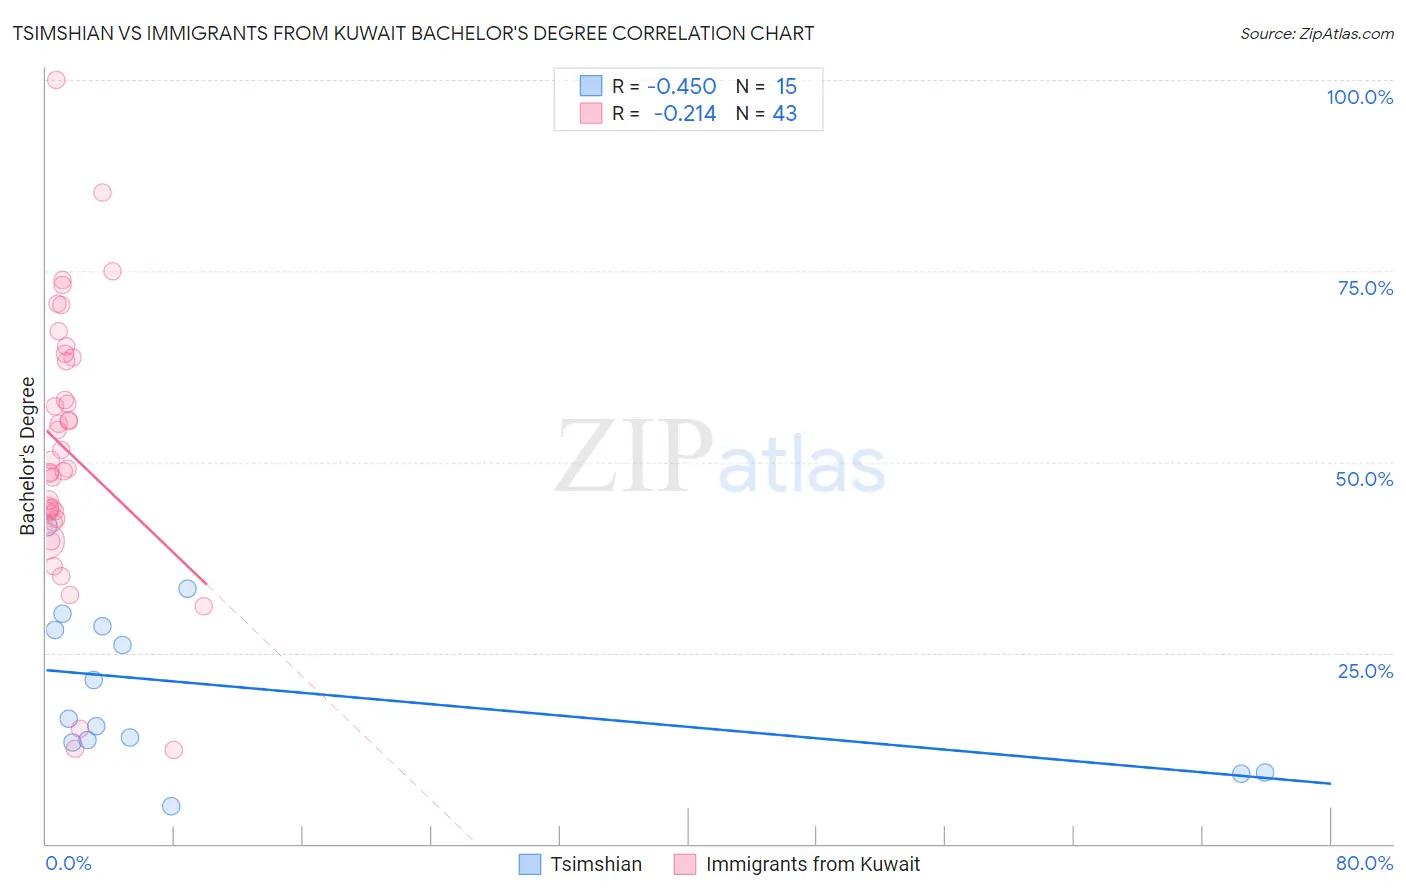
Tsimshian vs Immigrants from Kuwait Bachelor's Degree Correlation Chart
The statistical analysis conducted on geographies consisting of 15,626,544 people shows a moderate negative correlation between the proportion of Tsimshian and percentage of population with at least bachelor's degree education in the United States with a correlation coefficient (R) of -0.450 and weighted average of 28.8%. Similarly, the statistical analysis conducted on geographies consisting of 136,917,085 people shows a weak negative correlation between the proportion of Immigrants from Kuwait and percentage of population with at least bachelor's degree education in the United States with a correlation coefficient (R) of -0.214 and weighted average of 44.6%, a difference of 55.1%.
Bachelor's Degree Correlation Summary
| Measurement | Tsimshian | Immigrants from Kuwait |
| Minimum | 4.9% | 12.3% |
| Maximum | 41.6% | 100.0% |
| Range | 36.7% | 87.7% |
| Mean | 20.3% | 51.4% |
| Median | 16.4% | 49.2% |
| Interquartile 25% (IQ1) | 13.3% | 42.5% |
| Interquartile 75% (IQ3) | 28.5% | 63.7% |
| Interquartile Range (IQR) | 15.3% | 21.2% |
| Standard Deviation (Sample) | 10.5% | 17.8% |
| Standard Deviation (Population) | 10.1% | 17.6% |
Similar Demographics by Bachelor's Degree
Demographics Similar to Tsimshian by Bachelor's Degree
In terms of bachelor's degree, the demographic groups most similar to Tsimshian are Fijian (28.7%, a difference of 0.14%), Alaskan Athabascan (28.8%, a difference of 0.22%), Kiowa (28.8%, a difference of 0.30%), Creek (28.9%, a difference of 0.35%), and Yaqui (29.0%, a difference of 0.80%).
| Demographics | Rating | Rank | Bachelor's Degree |
| Immigrants | Cabo Verde | 0.0 /100 | #315 | Tragic 29.2% |
| Sioux | 0.0 /100 | #316 | Tragic 29.1% |
| Colville | 0.0 /100 | #317 | Tragic 29.0% |
| Yaqui | 0.0 /100 | #318 | Tragic 29.0% |
| Creek | 0.0 /100 | #319 | Tragic 28.9% |
| Kiowa | 0.0 /100 | #320 | Tragic 28.8% |
| Alaskan Athabascans | 0.0 /100 | #321 | Tragic 28.8% |
| Tsimshian | 0.0 /100 | #322 | Tragic 28.8% |
| Fijians | 0.0 /100 | #323 | Tragic 28.7% |
| Dutch West Indians | 0.0 /100 | #324 | Tragic 28.5% |
| Pennsylvania Germans | 0.0 /100 | #325 | Tragic 28.4% |
| Apache | 0.0 /100 | #326 | Tragic 28.3% |
| Paiute | 0.0 /100 | #327 | Tragic 28.1% |
| Crow | 0.0 /100 | #328 | Tragic 27.7% |
| Immigrants | Central America | 0.0 /100 | #329 | Tragic 27.5% |
Demographics Similar to Immigrants from Kuwait by Bachelor's Degree
In terms of bachelor's degree, the demographic groups most similar to Immigrants from Kuwait are Immigrants from Lithuania (44.6%, a difference of 0.030%), Immigrants from Bulgaria (44.6%, a difference of 0.060%), Bolivian (44.6%, a difference of 0.090%), Estonian (44.6%, a difference of 0.10%), and Immigrants from Norway (44.5%, a difference of 0.22%).
| Demographics | Rating | Rank | Bachelor's Degree |
| Bulgarians | 100.0 /100 | #38 | Exceptional 45.3% |
| Immigrants | Latvia | 100.0 /100 | #39 | Exceptional 45.1% |
| Immigrants | Belarus | 100.0 /100 | #40 | Exceptional 45.0% |
| Immigrants | Malaysia | 100.0 /100 | #41 | Exceptional 45.0% |
| Immigrants | Saudi Arabia | 100.0 /100 | #42 | Exceptional 44.8% |
| Immigrants | South Africa | 99.9 /100 | #43 | Exceptional 44.8% |
| Immigrants | Lithuania | 99.9 /100 | #44 | Exceptional 44.6% |
| Immigrants | Kuwait | 99.9 /100 | #45 | Exceptional 44.6% |
| Immigrants | Bulgaria | 99.9 /100 | #46 | Exceptional 44.6% |
| Bolivians | 99.9 /100 | #47 | Exceptional 44.6% |
| Estonians | 99.9 /100 | #48 | Exceptional 44.6% |
| Immigrants | Norway | 99.9 /100 | #49 | Exceptional 44.5% |
| Immigrants | Greece | 99.9 /100 | #50 | Exceptional 44.5% |
| Asians | 99.9 /100 | #51 | Exceptional 44.4% |
| Immigrants | Spain | 99.9 /100 | #52 | Exceptional 44.3% |