Cree vs Immigrants from Dominican Republic Unemployment Among Ages 35 to 44 years
COMPARE
Cree
Immigrants from Dominican Republic
Unemployment Among Ages 35 to 44 years
Unemployment Among Ages 35 to 44 years Comparison
Cree
Immigrants from Dominican Republic
5.5%
UNEMPLOYMENT AMONG AGES 35 TO 44 YEARS
0.0/ 100
METRIC RATING
288th/ 347
METRIC RANK
6.4%
UNEMPLOYMENT AMONG AGES 35 TO 44 YEARS
0.0/ 100
METRIC RATING
322nd/ 347
METRIC RANK
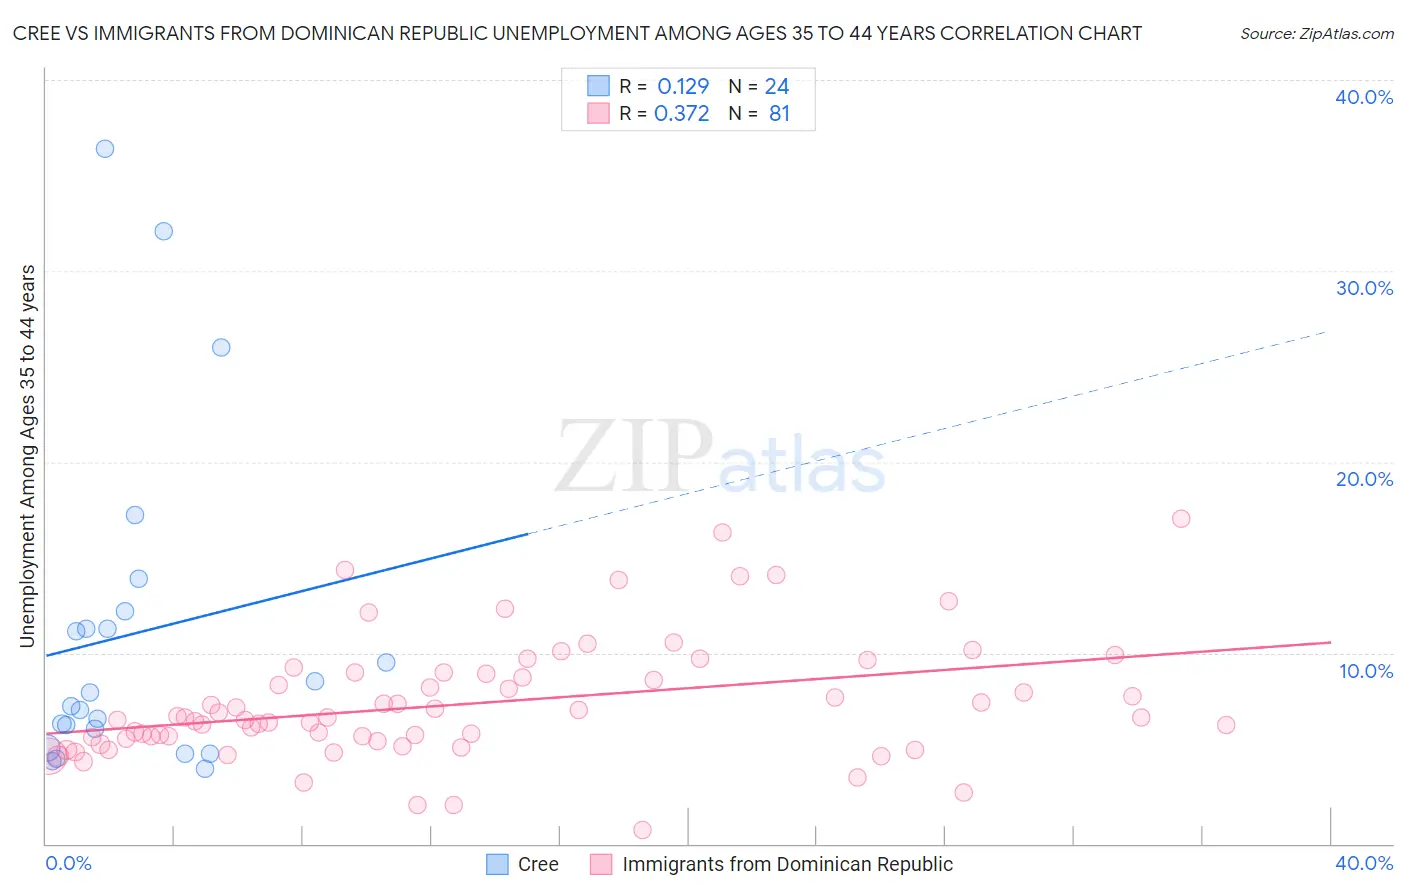
Cree vs Immigrants from Dominican Republic Unemployment Among Ages 35 to 44 years Correlation Chart
The statistical analysis conducted on geographies consisting of 75,629,723 people shows a poor positive correlation between the proportion of Cree and unemployment rate among population between the ages 35 and 44 in the United States with a correlation coefficient (R) of 0.129 and weighted average of 5.5%. Similarly, the statistical analysis conducted on geographies consisting of 270,621,781 people shows a mild positive correlation between the proportion of Immigrants from Dominican Republic and unemployment rate among population between the ages 35 and 44 in the United States with a correlation coefficient (R) of 0.372 and weighted average of 6.4%, a difference of 16.6%.
Unemployment Among Ages 35 to 44 years Correlation Summary
| Measurement | Cree | Immigrants from Dominican Republic |
| Minimum | 3.9% | 0.70% |
| Maximum | 36.4% | 17.0% |
| Range | 32.5% | 16.3% |
| Mean | 11.0% | 7.3% |
| Median | 7.5% | 6.6% |
| Interquartile 25% (IQ1) | 5.5% | 5.5% |
| Interquartile 75% (IQ3) | 11.7% | 8.9% |
| Interquartile Range (IQR) | 6.2% | 3.5% |
| Standard Deviation (Sample) | 8.7% | 3.1% |
| Standard Deviation (Population) | 8.6% | 3.1% |
Similar Demographics by Unemployment Among Ages 35 to 44 years
Demographics Similar to Cree by Unemployment Among Ages 35 to 44 years
In terms of unemployment among ages 35 to 44 years, the demographic groups most similar to Cree are French American Indian (5.5%, a difference of 0.16%), Immigrants from Micronesia (5.5%, a difference of 0.28%), Spanish American Indian (5.5%, a difference of 0.34%), Hispanic or Latino (5.5%, a difference of 0.40%), and Jamaican (5.5%, a difference of 0.42%).
| Demographics | Rating | Rank | Unemployment Among Ages 35 to 44 years |
| Immigrants | Portugal | 0.0 /100 | #281 | Tragic 5.4% |
| Immigrants | Ghana | 0.0 /100 | #282 | Tragic 5.4% |
| Immigrants | Ecuador | 0.0 /100 | #283 | Tragic 5.4% |
| Haitians | 0.0 /100 | #284 | Tragic 5.5% |
| Hispanics or Latinos | 0.0 /100 | #285 | Tragic 5.5% |
| Immigrants | Micronesia | 0.0 /100 | #286 | Tragic 5.5% |
| French American Indians | 0.0 /100 | #287 | Tragic 5.5% |
| Cree | 0.0 /100 | #288 | Tragic 5.5% |
| Spanish American Indians | 0.0 /100 | #289 | Tragic 5.5% |
| Jamaicans | 0.0 /100 | #290 | Tragic 5.5% |
| Dutch West Indians | 0.0 /100 | #291 | Tragic 5.5% |
| Immigrants | Haiti | 0.0 /100 | #292 | Tragic 5.5% |
| Central American Indians | 0.0 /100 | #293 | Tragic 5.6% |
| Trinidadians and Tobagonians | 0.0 /100 | #294 | Tragic 5.6% |
| Ottawa | 0.0 /100 | #295 | Tragic 5.6% |
Demographics Similar to Immigrants from Dominican Republic by Unemployment Among Ages 35 to 44 years
In terms of unemployment among ages 35 to 44 years, the demographic groups most similar to Immigrants from Dominican Republic are Dominican (6.4%, a difference of 0.080%), Menominee (6.5%, a difference of 1.7%), Immigrants from Yemen (6.6%, a difference of 2.0%), Alaska Native (6.6%, a difference of 2.1%), and Cape Verdean (6.6%, a difference of 2.2%).
| Demographics | Rating | Rank | Unemployment Among Ages 35 to 44 years |
| Blacks/African Americans | 0.0 /100 | #315 | Tragic 6.1% |
| Tsimshian | 0.0 /100 | #316 | Tragic 6.2% |
| Immigrants | St. Vincent and the Grenadines | 0.0 /100 | #317 | Tragic 6.2% |
| Colville | 0.0 /100 | #318 | Tragic 6.2% |
| Immigrants | Grenada | 0.0 /100 | #319 | Tragic 6.2% |
| Immigrants | Armenia | 0.0 /100 | #320 | Tragic 6.2% |
| Chippewa | 0.0 /100 | #321 | Tragic 6.2% |
| Immigrants | Dominican Republic | 0.0 /100 | #322 | Tragic 6.4% |
| Dominicans | 0.0 /100 | #323 | Tragic 6.4% |
| Menominee | 0.0 /100 | #324 | Tragic 6.5% |
| Immigrants | Yemen | 0.0 /100 | #325 | Tragic 6.6% |
| Alaska Natives | 0.0 /100 | #326 | Tragic 6.6% |
| Cape Verdeans | 0.0 /100 | #327 | Tragic 6.6% |
| Shoshone | 0.0 /100 | #328 | Tragic 6.6% |
| Paiute | 0.0 /100 | #329 | Tragic 6.9% |