Chilean vs Somali 2nd Grade
COMPARE
Chilean
Somali
2nd Grade
2nd Grade Comparison
Chileans
Somalis
97.9%
2ND GRADE
56.1/ 100
METRIC RATING
167th/ 347
METRIC RANK
97.0%
2ND GRADE
0.0/ 100
METRIC RATING
302nd/ 347
METRIC RANK
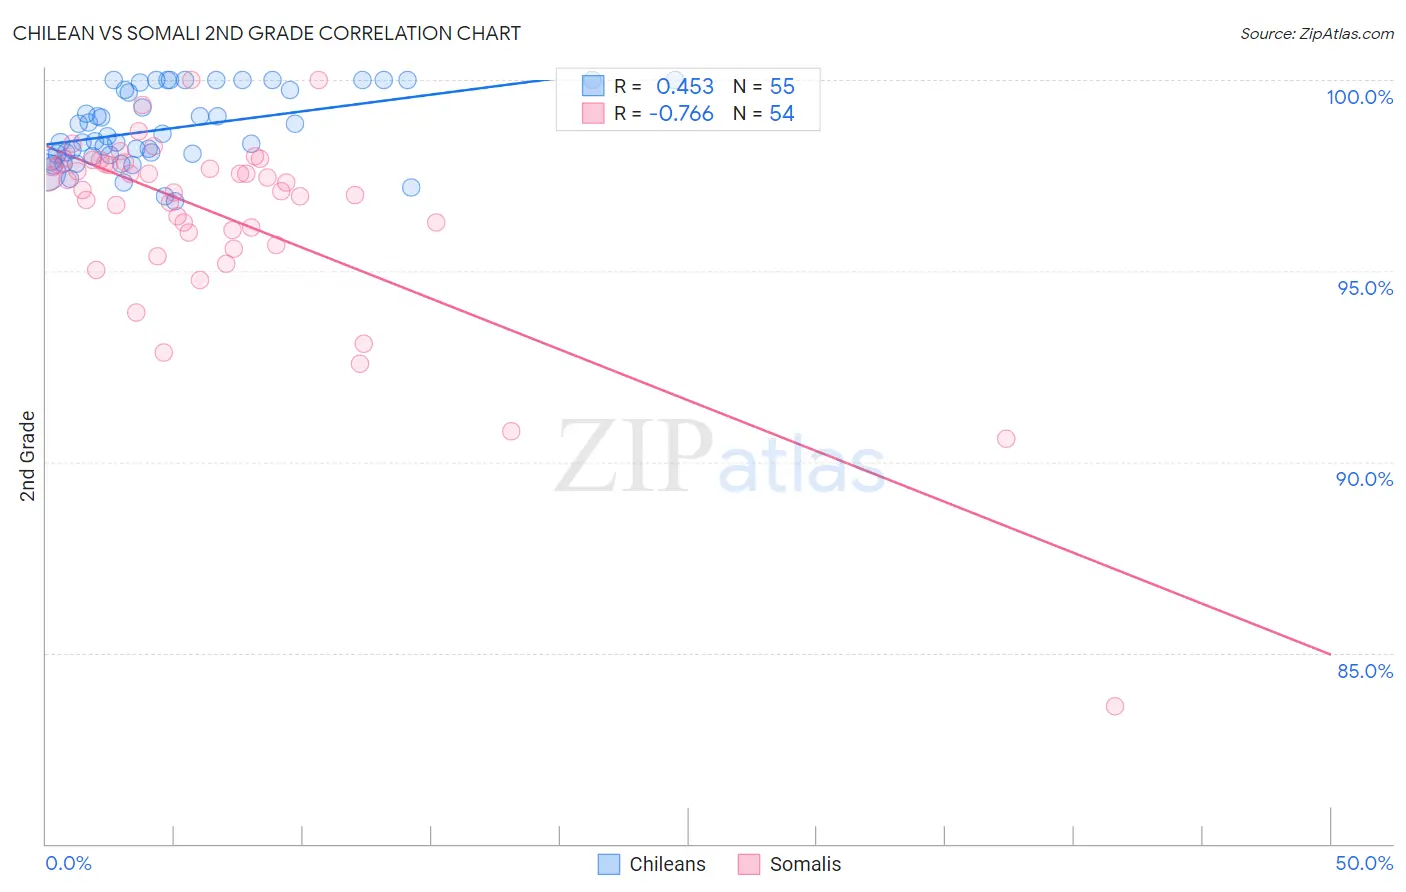
Chilean vs Somali 2nd Grade Correlation Chart
The statistical analysis conducted on geographies consisting of 256,684,337 people shows a moderate positive correlation between the proportion of Chileans and percentage of population with at least 2nd grade education in the United States with a correlation coefficient (R) of 0.453 and weighted average of 97.9%. Similarly, the statistical analysis conducted on geographies consisting of 99,332,457 people shows a strong negative correlation between the proportion of Somalis and percentage of population with at least 2nd grade education in the United States with a correlation coefficient (R) of -0.766 and weighted average of 97.0%, a difference of 0.96%.
2nd Grade Correlation Summary
| Measurement | Chilean | Somali |
| Minimum | 96.8% | 83.6% |
| Maximum | 100.0% | 100.0% |
| Range | 3.2% | 16.4% |
| Mean | 98.7% | 96.4% |
| Median | 98.5% | 97.2% |
| Interquartile 25% (IQ1) | 98.0% | 96.0% |
| Interquartile 75% (IQ3) | 99.9% | 97.8% |
| Interquartile Range (IQR) | 1.9% | 1.8% |
| Standard Deviation (Sample) | 0.96% | 2.6% |
| Standard Deviation (Population) | 0.95% | 2.6% |
Similar Demographics by 2nd Grade
Demographics Similar to Chileans by 2nd Grade
In terms of 2nd grade, the demographic groups most similar to Chileans are Ugandan (97.9%, a difference of 0.0%), Spanish American (97.9%, a difference of 0.0%), Immigrants from Jordan (97.9%, a difference of 0.0%), Brazilian (97.9%, a difference of 0.0%), and Immigrants from Spain (97.9%, a difference of 0.0%).
| Demographics | Rating | Rank | 2nd Grade |
| Immigrants | Eastern Europe | 61.1 /100 | #160 | Good 97.9% |
| Immigrants | Russia | 60.3 /100 | #161 | Good 97.9% |
| Immigrants | Italy | 60.2 /100 | #162 | Good 97.9% |
| Bermudans | 59.4 /100 | #163 | Average 97.9% |
| Ugandans | 56.6 /100 | #164 | Average 97.9% |
| Spanish Americans | 56.4 /100 | #165 | Average 97.9% |
| Immigrants | Jordan | 56.3 /100 | #166 | Average 97.9% |
| Chileans | 56.1 /100 | #167 | Average 97.9% |
| Brazilians | 55.8 /100 | #168 | Average 97.9% |
| Immigrants | Spain | 55.4 /100 | #169 | Average 97.9% |
| Navajo | 54.3 /100 | #170 | Average 97.9% |
| Albanians | 52.8 /100 | #171 | Average 97.9% |
| Immigrants | Korea | 52.7 /100 | #172 | Average 97.9% |
| Kenyans | 52.7 /100 | #173 | Average 97.9% |
| Immigrants | Micronesia | 50.0 /100 | #174 | Average 97.9% |
Demographics Similar to Somalis by 2nd Grade
In terms of 2nd grade, the demographic groups most similar to Somalis are Central American Indian (97.0%, a difference of 0.020%), Immigrants from South Eastern Asia (97.0%, a difference of 0.040%), Ecuadorian (96.9%, a difference of 0.040%), Immigrants from Caribbean (96.9%, a difference of 0.050%), and Immigrants from Cuba (97.0%, a difference of 0.060%).
| Demographics | Rating | Rank | 2nd Grade |
| Immigrants | Grenada | 0.0 /100 | #295 | Tragic 97.1% |
| Immigrants | Immigrants | 0.0 /100 | #296 | Tragic 97.1% |
| Immigrants | Cuba | 0.0 /100 | #297 | Tragic 97.0% |
| Immigrants | Dominica | 0.0 /100 | #298 | Tragic 97.0% |
| Haitians | 0.0 /100 | #299 | Tragic 97.0% |
| Immigrants | South Eastern Asia | 0.0 /100 | #300 | Tragic 97.0% |
| Central American Indians | 0.0 /100 | #301 | Tragic 97.0% |
| Somalis | 0.0 /100 | #302 | Tragic 97.0% |
| Ecuadorians | 0.0 /100 | #303 | Tragic 96.9% |
| Immigrants | Caribbean | 0.0 /100 | #304 | Tragic 96.9% |
| Nicaraguans | 0.0 /100 | #305 | Tragic 96.9% |
| Immigrants | Somalia | 0.0 /100 | #306 | Tragic 96.9% |
| Immigrants | Azores | 0.0 /100 | #307 | Tragic 96.8% |
| Immigrants | Haiti | 0.0 /100 | #308 | Tragic 96.8% |
| Belizeans | 0.0 /100 | #309 | Tragic 96.8% |