Zimbabwean vs Somali 2nd Grade
COMPARE
Zimbabwean
Somali
2nd Grade
2nd Grade Comparison
Zimbabweans
Somalis
98.2%
2ND GRADE
98.8/ 100
METRIC RATING
90th/ 347
METRIC RANK
97.0%
2ND GRADE
0.0/ 100
METRIC RATING
302nd/ 347
METRIC RANK
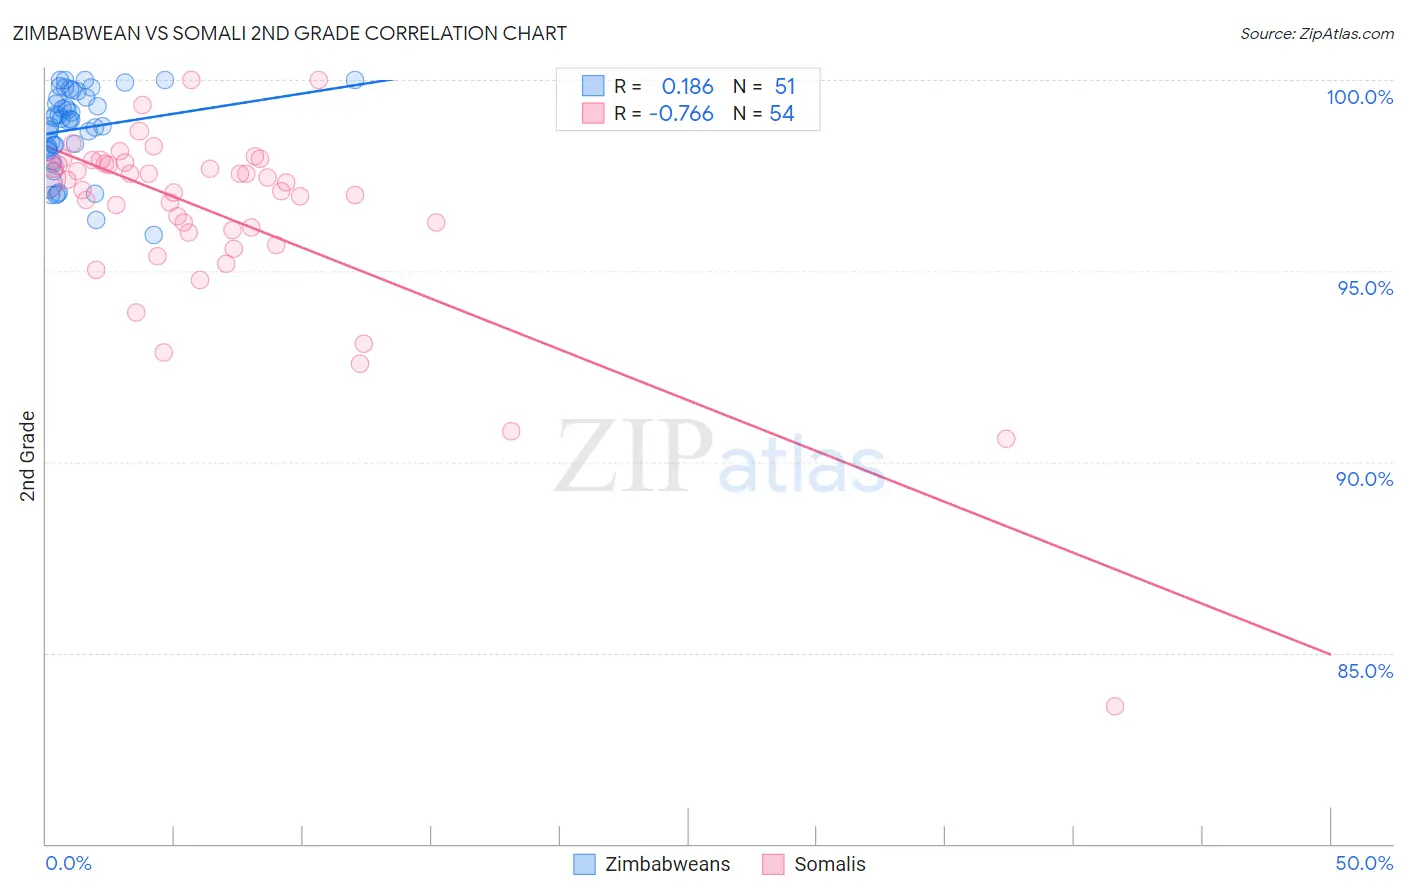
Zimbabwean vs Somali 2nd Grade Correlation Chart
The statistical analysis conducted on geographies consisting of 69,203,423 people shows a poor positive correlation between the proportion of Zimbabweans and percentage of population with at least 2nd grade education in the United States with a correlation coefficient (R) of 0.186 and weighted average of 98.2%. Similarly, the statistical analysis conducted on geographies consisting of 99,332,457 people shows a strong negative correlation between the proportion of Somalis and percentage of population with at least 2nd grade education in the United States with a correlation coefficient (R) of -0.766 and weighted average of 97.0%, a difference of 1.3%.
2nd Grade Correlation Summary
| Measurement | Zimbabwean | Somali |
| Minimum | 95.9% | 83.6% |
| Maximum | 100.0% | 100.0% |
| Range | 4.1% | 16.4% |
| Mean | 98.7% | 96.4% |
| Median | 99.0% | 97.2% |
| Interquartile 25% (IQ1) | 98.2% | 96.0% |
| Interquartile 75% (IQ3) | 99.6% | 97.8% |
| Interquartile Range (IQR) | 1.4% | 1.8% |
| Standard Deviation (Sample) | 1.0% | 2.6% |
| Standard Deviation (Population) | 1.0% | 2.6% |
Similar Demographics by 2nd Grade
Demographics Similar to Zimbabweans by 2nd Grade
In terms of 2nd grade, the demographic groups most similar to Zimbabweans are Immigrants from Western Europe (98.2%, a difference of 0.0%), Immigrants from South Africa (98.2%, a difference of 0.0%), Immigrants from India (98.2%, a difference of 0.0%), Immigrants from Australia (98.2%, a difference of 0.010%), and Immigrants from Denmark (98.2%, a difference of 0.010%).
| Demographics | Rating | Rank | 2nd Grade |
| Immigrants | Sweden | 99.1 /100 | #83 | Exceptional 98.2% |
| Hopi | 99.1 /100 | #84 | Exceptional 98.2% |
| Potawatomi | 99.1 /100 | #85 | Exceptional 98.2% |
| Immigrants | Australia | 99.0 /100 | #86 | Exceptional 98.2% |
| Immigrants | Denmark | 99.0 /100 | #87 | Exceptional 98.2% |
| Macedonians | 99.0 /100 | #88 | Exceptional 98.2% |
| Ukrainians | 98.9 /100 | #89 | Exceptional 98.2% |
| Zimbabweans | 98.8 /100 | #90 | Exceptional 98.2% |
| Immigrants | Western Europe | 98.8 /100 | #91 | Exceptional 98.2% |
| Immigrants | South Africa | 98.8 /100 | #92 | Exceptional 98.2% |
| Immigrants | India | 98.8 /100 | #93 | Exceptional 98.2% |
| Immigrants | Germany | 98.6 /100 | #94 | Exceptional 98.2% |
| South Africans | 98.6 /100 | #95 | Exceptional 98.2% |
| Cypriots | 98.4 /100 | #96 | Exceptional 98.2% |
| Choctaw | 98.3 /100 | #97 | Exceptional 98.2% |
Demographics Similar to Somalis by 2nd Grade
In terms of 2nd grade, the demographic groups most similar to Somalis are Central American Indian (97.0%, a difference of 0.020%), Immigrants from South Eastern Asia (97.0%, a difference of 0.040%), Ecuadorian (96.9%, a difference of 0.040%), Immigrants from Caribbean (96.9%, a difference of 0.050%), and Immigrants from Cuba (97.0%, a difference of 0.060%).
| Demographics | Rating | Rank | 2nd Grade |
| Immigrants | Grenada | 0.0 /100 | #295 | Tragic 97.1% |
| Immigrants | Immigrants | 0.0 /100 | #296 | Tragic 97.1% |
| Immigrants | Cuba | 0.0 /100 | #297 | Tragic 97.0% |
| Immigrants | Dominica | 0.0 /100 | #298 | Tragic 97.0% |
| Haitians | 0.0 /100 | #299 | Tragic 97.0% |
| Immigrants | South Eastern Asia | 0.0 /100 | #300 | Tragic 97.0% |
| Central American Indians | 0.0 /100 | #301 | Tragic 97.0% |
| Somalis | 0.0 /100 | #302 | Tragic 97.0% |
| Ecuadorians | 0.0 /100 | #303 | Tragic 96.9% |
| Immigrants | Caribbean | 0.0 /100 | #304 | Tragic 96.9% |
| Nicaraguans | 0.0 /100 | #305 | Tragic 96.9% |
| Immigrants | Somalia | 0.0 /100 | #306 | Tragic 96.9% |
| Immigrants | Azores | 0.0 /100 | #307 | Tragic 96.8% |
| Immigrants | Haiti | 0.0 /100 | #308 | Tragic 96.8% |
| Belizeans | 0.0 /100 | #309 | Tragic 96.8% |