Armenian vs Immigrants from Bolivia No Schooling Completed
COMPARE
Armenian
Immigrants from Bolivia
No Schooling Completed
No Schooling Completed Comparison
Armenians
Immigrants from Bolivia
2.5%
NO SCHOOLING COMPLETED
0.5/ 100
METRIC RATING
261st/ 347
METRIC RANK
2.5%
NO SCHOOLING COMPLETED
0.2/ 100
METRIC RATING
272nd/ 347
METRIC RANK
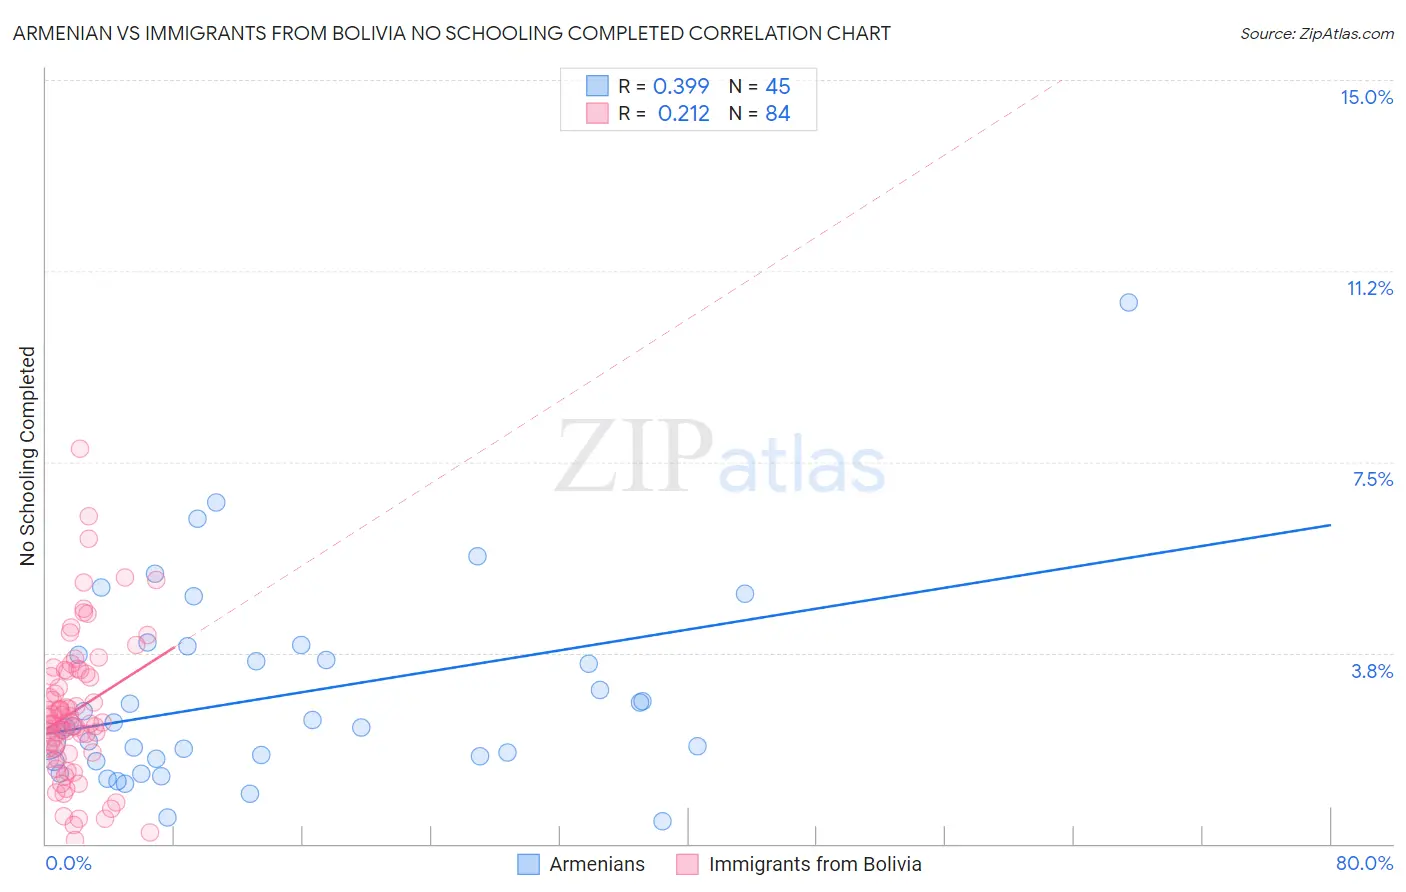
Armenian vs Immigrants from Bolivia No Schooling Completed Correlation Chart
The statistical analysis conducted on geographies consisting of 308,093,829 people shows a mild positive correlation between the proportion of Armenians and percentage of population with no schooling in the United States with a correlation coefficient (R) of 0.399 and weighted average of 2.5%. Similarly, the statistical analysis conducted on geographies consisting of 158,366,441 people shows a weak positive correlation between the proportion of Immigrants from Bolivia and percentage of population with no schooling in the United States with a correlation coefficient (R) of 0.212 and weighted average of 2.5%, a difference of 2.9%.
No Schooling Completed Correlation Summary
| Measurement | Armenian | Immigrants from Bolivia |
| Minimum | 0.45% | 0.063% |
| Maximum | 10.6% | 7.8% |
| Range | 10.2% | 7.7% |
| Mean | 2.9% | 2.6% |
| Median | 2.3% | 2.4% |
| Interquartile 25% (IQ1) | 1.7% | 1.8% |
| Interquartile 75% (IQ3) | 3.8% | 3.4% |
| Interquartile Range (IQR) | 2.1% | 1.5% |
| Standard Deviation (Sample) | 1.9% | 1.4% |
| Standard Deviation (Population) | 1.9% | 1.4% |
Demographics Similar to Armenians and Immigrants from Bolivia by No Schooling Completed
In terms of no schooling completed, the demographic groups most similar to Armenians are Immigrants from Ethiopia (2.5%, a difference of 0.13%), Immigrants from Jamaica (2.5%, a difference of 0.17%), Assyrian/Chaldean/Syriac (2.5%, a difference of 0.23%), Immigrants from South America (2.5%, a difference of 0.26%), and Immigrants from Sierra Leone (2.5%, a difference of 0.35%). Similarly, the demographic groups most similar to Immigrants from Bolivia are Cuban (2.5%, a difference of 0.53%), Immigrants from Peru (2.5%, a difference of 0.54%), Immigrants from Nigeria (2.5%, a difference of 0.62%), Immigrants from Cameroon (2.5%, a difference of 0.79%), and Ghanaian (2.6%, a difference of 1.2%).
| Demographics | Rating | Rank | No Schooling Completed |
| Yaqui | 0.8 /100 | #256 | Tragic 2.4% |
| Immigrants | South America | 0.6 /100 | #257 | Tragic 2.5% |
| Assyrians/Chaldeans/Syriacs | 0.6 /100 | #258 | Tragic 2.5% |
| Immigrants | Jamaica | 0.6 /100 | #259 | Tragic 2.5% |
| Immigrants | Ethiopia | 0.6 /100 | #260 | Tragic 2.5% |
| Armenians | 0.5 /100 | #261 | Tragic 2.5% |
| Immigrants | Sierra Leone | 0.5 /100 | #262 | Tragic 2.5% |
| Immigrants | Liberia | 0.4 /100 | #263 | Tragic 2.5% |
| Indians (Asian) | 0.4 /100 | #264 | Tragic 2.5% |
| West Indians | 0.4 /100 | #265 | Tragic 2.5% |
| Fijians | 0.4 /100 | #266 | Tragic 2.5% |
| Yuman | 0.4 /100 | #267 | Tragic 2.5% |
| Taiwanese | 0.3 /100 | #268 | Tragic 2.5% |
| Immigrants | Nigeria | 0.2 /100 | #269 | Tragic 2.5% |
| Immigrants | Peru | 0.2 /100 | #270 | Tragic 2.5% |
| Cubans | 0.2 /100 | #271 | Tragic 2.5% |
| Immigrants | Bolivia | 0.2 /100 | #272 | Tragic 2.5% |
| Immigrants | Cameroon | 0.1 /100 | #273 | Tragic 2.5% |
| Ghanaians | 0.1 /100 | #274 | Tragic 2.6% |
| Immigrants | China | 0.1 /100 | #275 | Tragic 2.6% |
| Immigrants | Western Africa | 0.1 /100 | #276 | Tragic 2.6% |