Colville vs Immigrants from Northern Europe No Schooling Completed
COMPARE
Colville
Immigrants from Northern Europe
No Schooling Completed
No Schooling Completed Comparison
Colville
Immigrants from Northern Europe
1.9%
NO SCHOOLING COMPLETED
90.4/ 100
METRIC RATING
132nd/ 347
METRIC RANK
1.7%
NO SCHOOLING COMPLETED
99.8/ 100
METRIC RATING
62nd/ 347
METRIC RANK
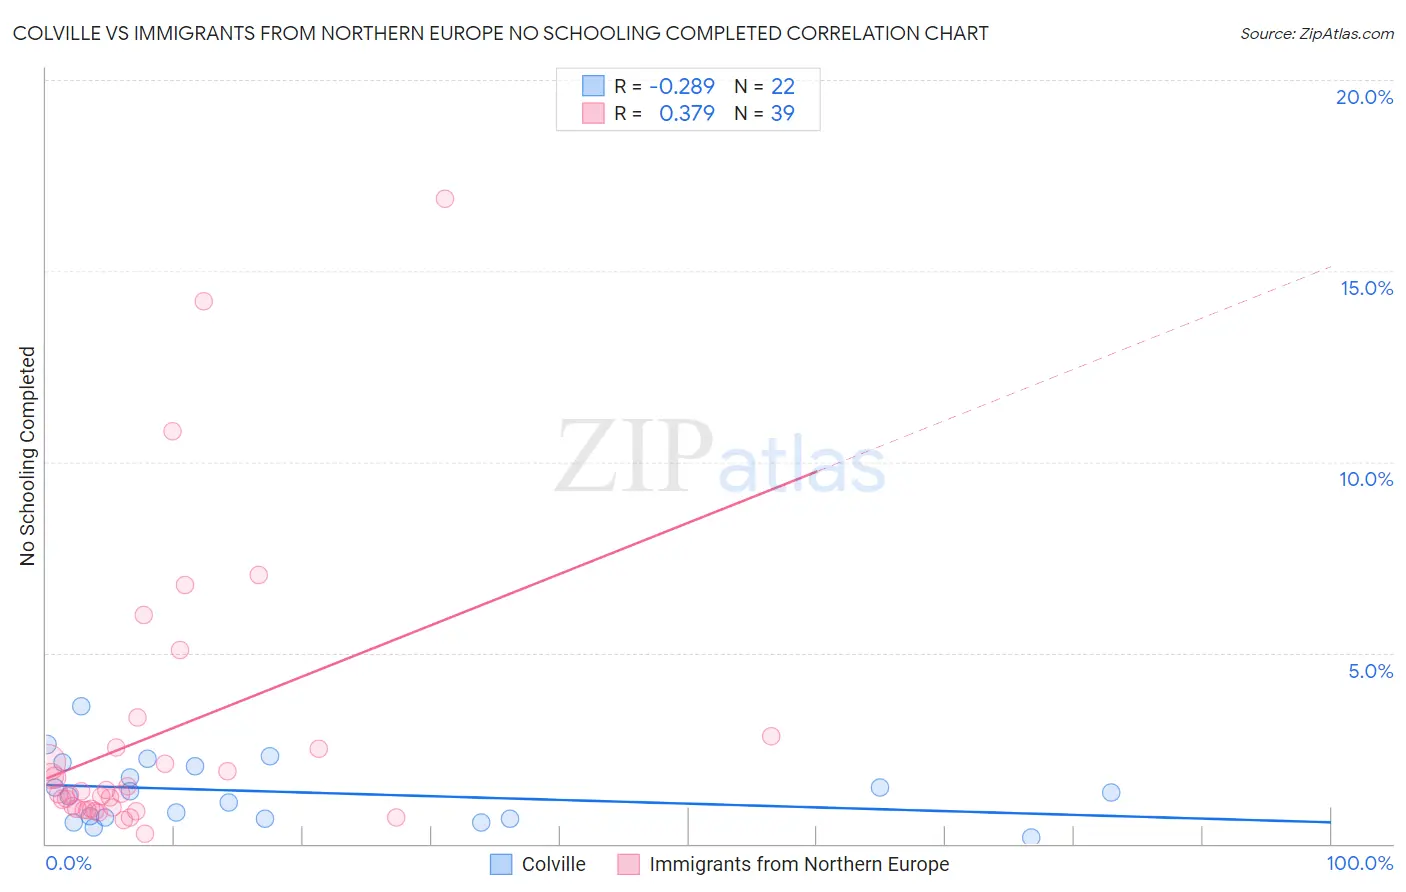
Colville vs Immigrants from Northern Europe No Schooling Completed Correlation Chart
The statistical analysis conducted on geographies consisting of 34,498,790 people shows a weak negative correlation between the proportion of Colville and percentage of population with no schooling in the United States with a correlation coefficient (R) of -0.289 and weighted average of 1.9%. Similarly, the statistical analysis conducted on geographies consisting of 468,916,494 people shows a mild positive correlation between the proportion of Immigrants from Northern Europe and percentage of population with no schooling in the United States with a correlation coefficient (R) of 0.379 and weighted average of 1.7%, a difference of 15.9%.
No Schooling Completed Correlation Summary
| Measurement | Colville | Immigrants from Northern Europe |
| Minimum | 0.15% | 0.25% |
| Maximum | 3.6% | 16.9% |
| Range | 3.4% | 16.7% |
| Mean | 1.4% | 2.8% |
| Median | 1.3% | 1.3% |
| Interquartile 25% (IQ1) | 0.67% | 0.91% |
| Interquartile 75% (IQ3) | 2.0% | 2.5% |
| Interquartile Range (IQR) | 1.4% | 1.6% |
| Standard Deviation (Sample) | 0.85% | 3.7% |
| Standard Deviation (Population) | 0.83% | 3.7% |
Similar Demographics by No Schooling Completed
Demographics Similar to Colville by No Schooling Completed
In terms of no schooling completed, the demographic groups most similar to Colville are Immigrants from Turkey (1.9%, a difference of 0.10%), Menominee (1.9%, a difference of 0.35%), Immigrants from Hungary (1.9%, a difference of 0.50%), Palestinian (1.9%, a difference of 0.61%), and Seminole (1.9%, a difference of 0.72%).
| Demographics | Rating | Rank | No Schooling Completed |
| Immigrants | Europe | 93.7 /100 | #125 | Exceptional 1.9% |
| Immigrants | Romania | 92.6 /100 | #126 | Exceptional 1.9% |
| Israelis | 92.4 /100 | #127 | Exceptional 1.9% |
| Spaniards | 92.3 /100 | #128 | Exceptional 1.9% |
| Seminole | 92.0 /100 | #129 | Exceptional 1.9% |
| Palestinians | 91.8 /100 | #130 | Exceptional 1.9% |
| Immigrants | Hungary | 91.6 /100 | #131 | Exceptional 1.9% |
| Colville | 90.4 /100 | #132 | Exceptional 1.9% |
| Immigrants | Turkey | 90.2 /100 | #133 | Exceptional 1.9% |
| Menominee | 89.6 /100 | #134 | Excellent 1.9% |
| Hmong | 88.5 /100 | #135 | Excellent 1.9% |
| Burmese | 88.2 /100 | #136 | Excellent 1.9% |
| Filipinos | 85.5 /100 | #137 | Excellent 2.0% |
| Immigrants | Israel | 85.4 /100 | #138 | Excellent 2.0% |
| Jordanians | 84.5 /100 | #139 | Excellent 2.0% |
Demographics Similar to Immigrants from Northern Europe by No Schooling Completed
In terms of no schooling completed, the demographic groups most similar to Immigrants from Northern Europe are Russian (1.7%, a difference of 0.040%), New Zealander (1.7%, a difference of 0.20%), Serbian (1.7%, a difference of 0.24%), Canadian (1.7%, a difference of 0.38%), and Immigrants from Austria (1.7%, a difference of 0.57%).
| Demographics | Rating | Rank | No Schooling Completed |
| Greeks | 99.8 /100 | #55 | Exceptional 1.6% |
| Immigrants | North America | 99.8 /100 | #56 | Exceptional 1.6% |
| Austrians | 99.8 /100 | #57 | Exceptional 1.6% |
| Kiowa | 99.8 /100 | #58 | Exceptional 1.6% |
| Slavs | 99.8 /100 | #59 | Exceptional 1.7% |
| Americans | 99.8 /100 | #60 | Exceptional 1.7% |
| Tsimshian | 99.8 /100 | #61 | Exceptional 1.7% |
| Immigrants | Northern Europe | 99.8 /100 | #62 | Exceptional 1.7% |
| Russians | 99.8 /100 | #63 | Exceptional 1.7% |
| New Zealanders | 99.7 /100 | #64 | Exceptional 1.7% |
| Serbians | 99.7 /100 | #65 | Exceptional 1.7% |
| Canadians | 99.7 /100 | #66 | Exceptional 1.7% |
| Immigrants | Austria | 99.7 /100 | #67 | Exceptional 1.7% |
| Immigrants | Lithuania | 99.7 /100 | #68 | Exceptional 1.7% |
| Chickasaw | 99.6 /100 | #69 | Exceptional 1.7% |