Chippewa vs Ukrainian Kindergarten
COMPARE
Chippewa
Ukrainian
Kindergarten
Kindergarten Comparison
Chippewa
Ukrainians
98.5%
KINDERGARTEN
99.9/ 100
METRIC RATING
39th/ 347
METRIC RANK
98.3%
KINDERGARTEN
98.8/ 100
METRIC RATING
88th/ 347
METRIC RANK
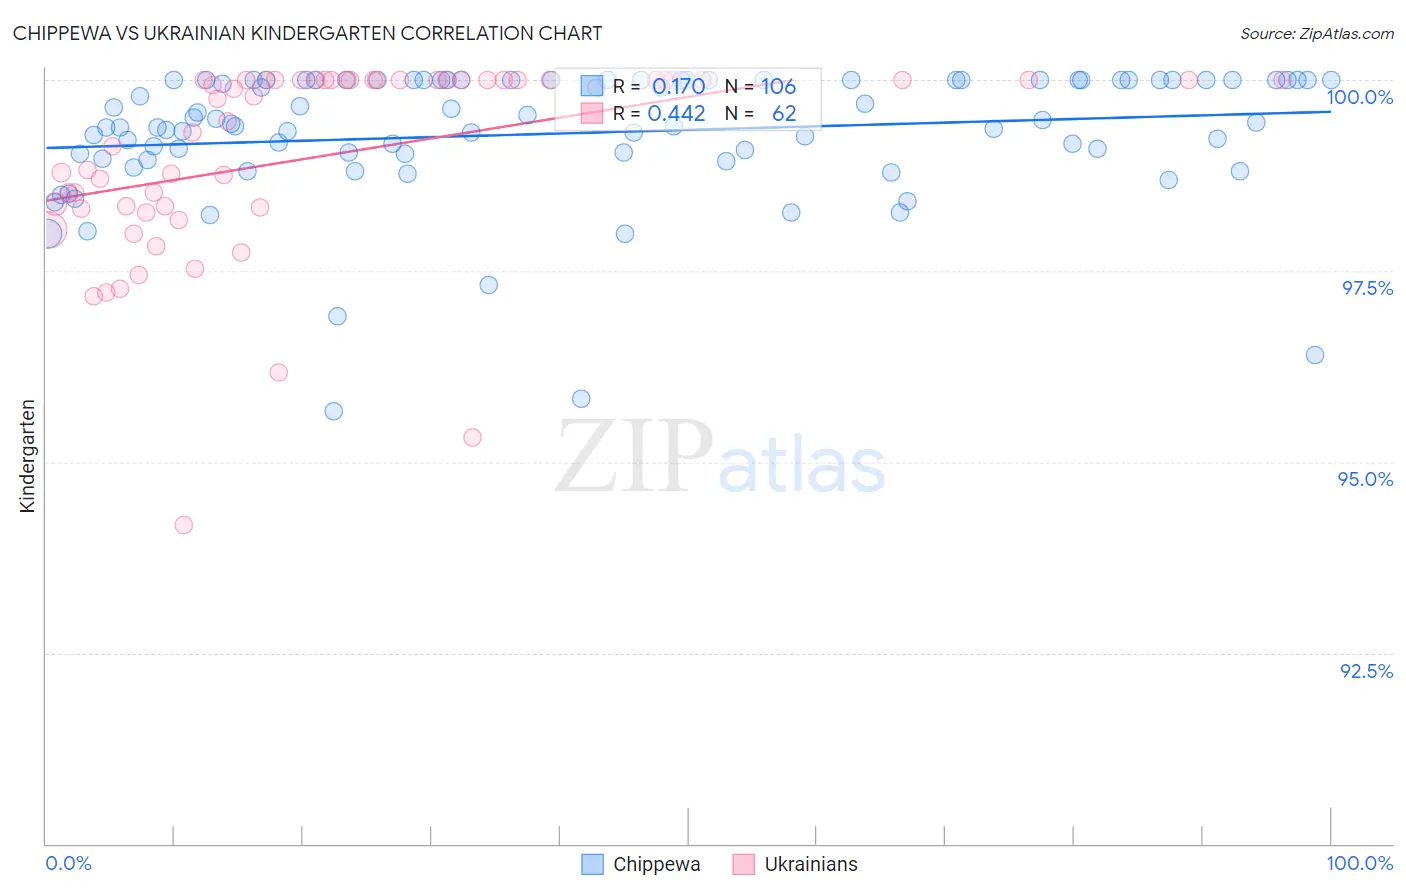
Chippewa vs Ukrainian Kindergarten Correlation Chart
The statistical analysis conducted on geographies consisting of 215,065,644 people shows a poor positive correlation between the proportion of Chippewa and percentage of population with at least kindergarten education in the United States with a correlation coefficient (R) of 0.170 and weighted average of 98.5%. Similarly, the statistical analysis conducted on geographies consisting of 448,698,169 people shows a moderate positive correlation between the proportion of Ukrainians and percentage of population with at least kindergarten education in the United States with a correlation coefficient (R) of 0.442 and weighted average of 98.3%, a difference of 0.22%.
Kindergarten Correlation Summary
| Measurement | Chippewa | Ukrainian |
| Minimum | 95.7% | 94.2% |
| Maximum | 100.0% | 100.0% |
| Range | 4.3% | 5.8% |
| Mean | 99.3% | 99.0% |
| Median | 99.4% | 99.8% |
| Interquartile 25% (IQ1) | 99.0% | 98.3% |
| Interquartile 75% (IQ3) | 100.0% | 100.0% |
| Interquartile Range (IQR) | 0.97% | 1.7% |
| Standard Deviation (Sample) | 0.87% | 1.3% |
| Standard Deviation (Population) | 0.86% | 1.3% |
Similar Demographics by Kindergarten
Demographics Similar to Chippewa by Kindergarten
In terms of kindergarten, the demographic groups most similar to Chippewa are Latvian (98.5%, a difference of 0.0%), Italian (98.5%, a difference of 0.010%), Luxembourger (98.5%, a difference of 0.010%), Eastern European (98.5%, a difference of 0.010%), and Native Hawaiian (98.5%, a difference of 0.010%).
| Demographics | Rating | Rank | Kindergarten |
| French Canadians | 100.0 /100 | #32 | Exceptional 98.6% |
| Scandinavians | 100.0 /100 | #33 | Exceptional 98.6% |
| Chinese | 100.0 /100 | #34 | Exceptional 98.5% |
| Swiss | 100.0 /100 | #35 | Exceptional 98.5% |
| British | 99.9 /100 | #36 | Exceptional 98.5% |
| Italians | 99.9 /100 | #37 | Exceptional 98.5% |
| Latvians | 99.9 /100 | #38 | Exceptional 98.5% |
| Chippewa | 99.9 /100 | #39 | Exceptional 98.5% |
| Luxembourgers | 99.9 /100 | #40 | Exceptional 98.5% |
| Eastern Europeans | 99.9 /100 | #41 | Exceptional 98.5% |
| Native Hawaiians | 99.9 /100 | #42 | Exceptional 98.5% |
| Lumbee | 99.9 /100 | #43 | Exceptional 98.5% |
| Northern Europeans | 99.9 /100 | #44 | Exceptional 98.5% |
| Belgians | 99.9 /100 | #45 | Exceptional 98.5% |
| Hungarians | 99.9 /100 | #46 | Exceptional 98.5% |
Demographics Similar to Ukrainians by Kindergarten
In terms of kindergarten, the demographic groups most similar to Ukrainians are Immigrants from South Africa (98.3%, a difference of 0.0%), Zimbabwean (98.3%, a difference of 0.0%), Immigrants from Western Europe (98.3%, a difference of 0.0%), Hopi (98.3%, a difference of 0.010%), and Immigrants from Australia (98.3%, a difference of 0.010%).
| Demographics | Rating | Rank | Kindergarten |
| Icelanders | 99.2 /100 | #81 | Exceptional 98.3% |
| Potawatomi | 99.2 /100 | #82 | Exceptional 98.3% |
| Osage | 99.1 /100 | #83 | Exceptional 98.3% |
| Immigrants | Denmark | 99.1 /100 | #84 | Exceptional 98.3% |
| Immigrants | Sweden | 99.1 /100 | #85 | Exceptional 98.3% |
| Hopi | 99.0 /100 | #86 | Exceptional 98.3% |
| Immigrants | Australia | 99.0 /100 | #87 | Exceptional 98.3% |
| Ukrainians | 98.8 /100 | #88 | Exceptional 98.3% |
| Immigrants | South Africa | 98.8 /100 | #89 | Exceptional 98.3% |
| Zimbabweans | 98.8 /100 | #90 | Exceptional 98.3% |
| Immigrants | Western Europe | 98.8 /100 | #91 | Exceptional 98.3% |
| Macedonians | 98.7 /100 | #92 | Exceptional 98.3% |
| Immigrants | India | 98.6 /100 | #93 | Exceptional 98.3% |
| South Africans | 98.5 /100 | #94 | Exceptional 98.3% |
| Immigrants | Germany | 98.5 /100 | #95 | Exceptional 98.3% |