Chippewa vs Immigrants from Western Europe College, Under 1 year
COMPARE
Chippewa
Immigrants from Western Europe
College, Under 1 year
College, Under 1 year Comparison
Chippewa
Immigrants from Western Europe
62.6%
COLLEGE, UNDER 1 YEAR
2.0/ 100
METRIC RATING
234th/ 347
METRIC RANK
68.5%
COLLEGE, UNDER 1 YEAR
98.6/ 100
METRIC RATING
75th/ 347
METRIC RANK
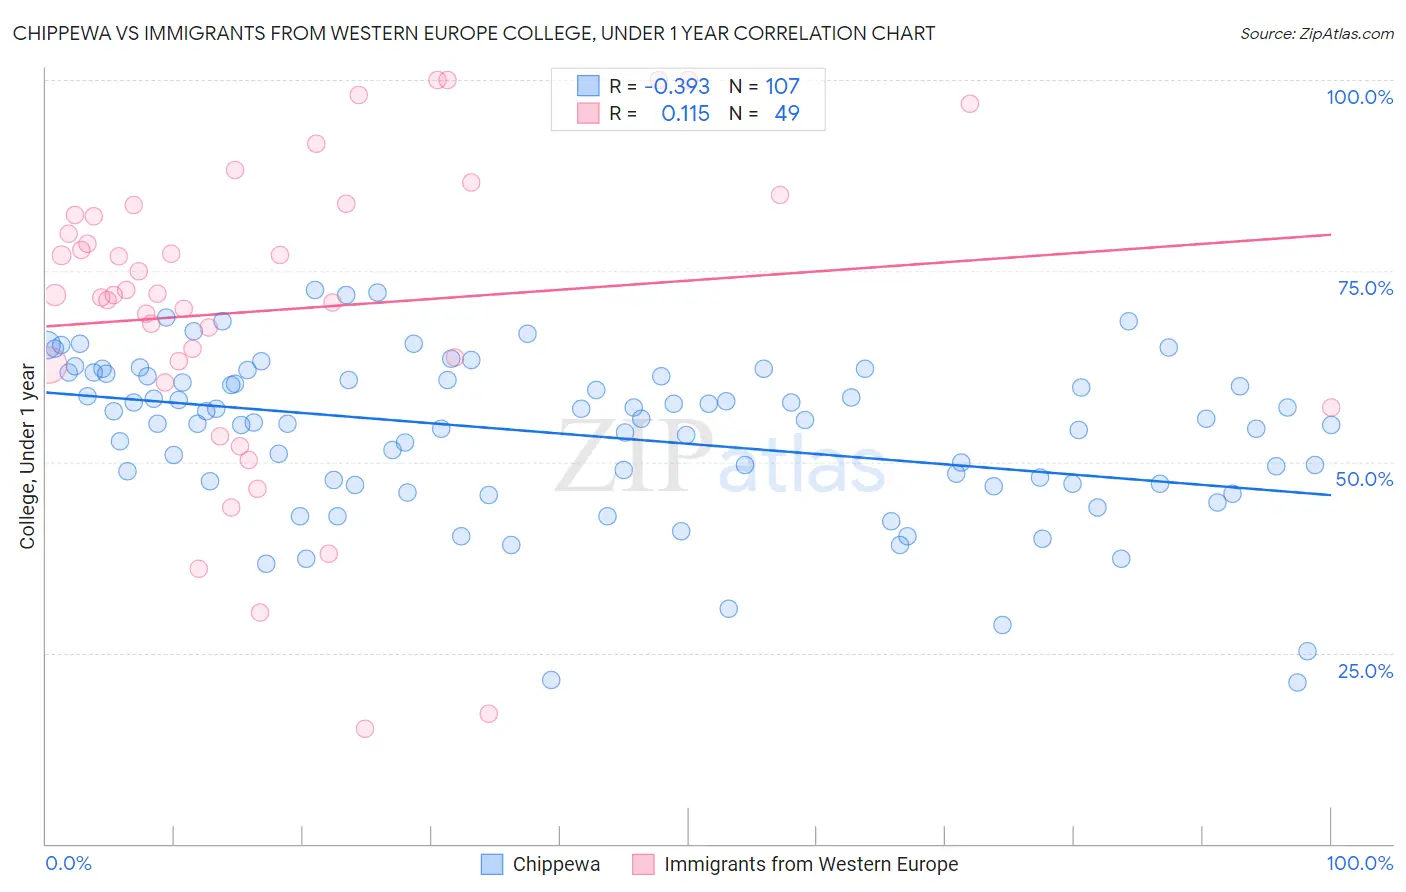
Chippewa vs Immigrants from Western Europe College, Under 1 year Correlation Chart
The statistical analysis conducted on geographies consisting of 215,068,018 people shows a mild negative correlation between the proportion of Chippewa and percentage of population with at least college, under 1 year education in the United States with a correlation coefficient (R) of -0.393 and weighted average of 62.6%. Similarly, the statistical analysis conducted on geographies consisting of 494,076,682 people shows a poor positive correlation between the proportion of Immigrants from Western Europe and percentage of population with at least college, under 1 year education in the United States with a correlation coefficient (R) of 0.115 and weighted average of 68.5%, a difference of 9.4%.
College, Under 1 year Correlation Summary
| Measurement | Chippewa | Immigrants from Western Europe |
| Minimum | 21.2% | 15.0% |
| Maximum | 72.5% | 100.0% |
| Range | 51.3% | 85.0% |
| Mean | 53.6% | 70.0% |
| Median | 55.5% | 71.9% |
| Interquartile 25% (IQ1) | 47.2% | 61.5% |
| Interquartile 75% (IQ3) | 61.1% | 82.9% |
| Interquartile Range (IQR) | 14.0% | 21.4% |
| Standard Deviation (Sample) | 10.5% | 20.3% |
| Standard Deviation (Population) | 10.5% | 20.1% |
Similar Demographics by College, Under 1 year
Demographics Similar to Chippewa by College, Under 1 year
In terms of college, under 1 year, the demographic groups most similar to Chippewa are Iroquois (62.6%, a difference of 0.030%), Spanish American (62.6%, a difference of 0.050%), Osage (62.7%, a difference of 0.15%), Immigrants (62.5%, a difference of 0.18%), and Immigrants from Burma/Myanmar (62.5%, a difference of 0.21%).
| Demographics | Rating | Rank | College, Under 1 year |
| Immigrants | Ghana | 3.7 /100 | #227 | Tragic 63.1% |
| Samoans | 3.3 /100 | #228 | Tragic 63.0% |
| Liberians | 3.2 /100 | #229 | Tragic 63.0% |
| Immigrants | Nonimmigrants | 3.0 /100 | #230 | Tragic 62.9% |
| Immigrants | Western Africa | 2.4 /100 | #231 | Tragic 62.8% |
| Osage | 2.2 /100 | #232 | Tragic 62.7% |
| Iroquois | 2.0 /100 | #233 | Tragic 62.6% |
| Chippewa | 2.0 /100 | #234 | Tragic 62.6% |
| Spanish Americans | 1.9 /100 | #235 | Tragic 62.6% |
| Immigrants | Immigrants | 1.7 /100 | #236 | Tragic 62.5% |
| Immigrants | Burma/Myanmar | 1.6 /100 | #237 | Tragic 62.5% |
| French American Indians | 1.5 /100 | #238 | Tragic 62.4% |
| Nepalese | 1.1 /100 | #239 | Tragic 62.2% |
| Aleuts | 1.1 /100 | #240 | Tragic 62.2% |
| Ottawa | 1.1 /100 | #241 | Tragic 62.2% |
Demographics Similar to Immigrants from Western Europe by College, Under 1 year
In terms of college, under 1 year, the demographic groups most similar to Immigrants from Western Europe are Laotian (68.5%, a difference of 0.0%), British (68.5%, a difference of 0.040%), Danish (68.5%, a difference of 0.060%), Greek (68.5%, a difference of 0.070%), and Immigrants from Spain (68.4%, a difference of 0.090%).
| Demographics | Rating | Rank | College, Under 1 year |
| Immigrants | Indonesia | 99.2 /100 | #68 | Exceptional 68.9% |
| Immigrants | Romania | 99.2 /100 | #69 | Exceptional 68.9% |
| Lithuanians | 99.1 /100 | #70 | Exceptional 68.8% |
| Immigrants | Europe | 99.1 /100 | #71 | Exceptional 68.8% |
| Bolivians | 99.0 /100 | #72 | Exceptional 68.7% |
| Immigrants | England | 99.0 /100 | #73 | Exceptional 68.7% |
| Swedes | 98.9 /100 | #74 | Exceptional 68.7% |
| Immigrants | Western Europe | 98.6 /100 | #75 | Exceptional 68.5% |
| Laotians | 98.6 /100 | #76 | Exceptional 68.5% |
| British | 98.6 /100 | #77 | Exceptional 68.5% |
| Danes | 98.6 /100 | #78 | Exceptional 68.5% |
| Greeks | 98.6 /100 | #79 | Exceptional 68.5% |
| Immigrants | Spain | 98.5 /100 | #80 | Exceptional 68.4% |
| Immigrants | Greece | 98.5 /100 | #81 | Exceptional 68.4% |
| Norwegians | 98.4 /100 | #82 | Exceptional 68.4% |