Chippewa vs Austrian 4th Grade
COMPARE
Chippewa
Austrian
4th Grade
4th Grade Comparison
Chippewa
Austrians
98.2%
4TH GRADE
100.0/ 100
METRIC RATING
34th/ 347
METRIC RANK
98.1%
4TH GRADE
99.8/ 100
METRIC RATING
57th/ 347
METRIC RANK
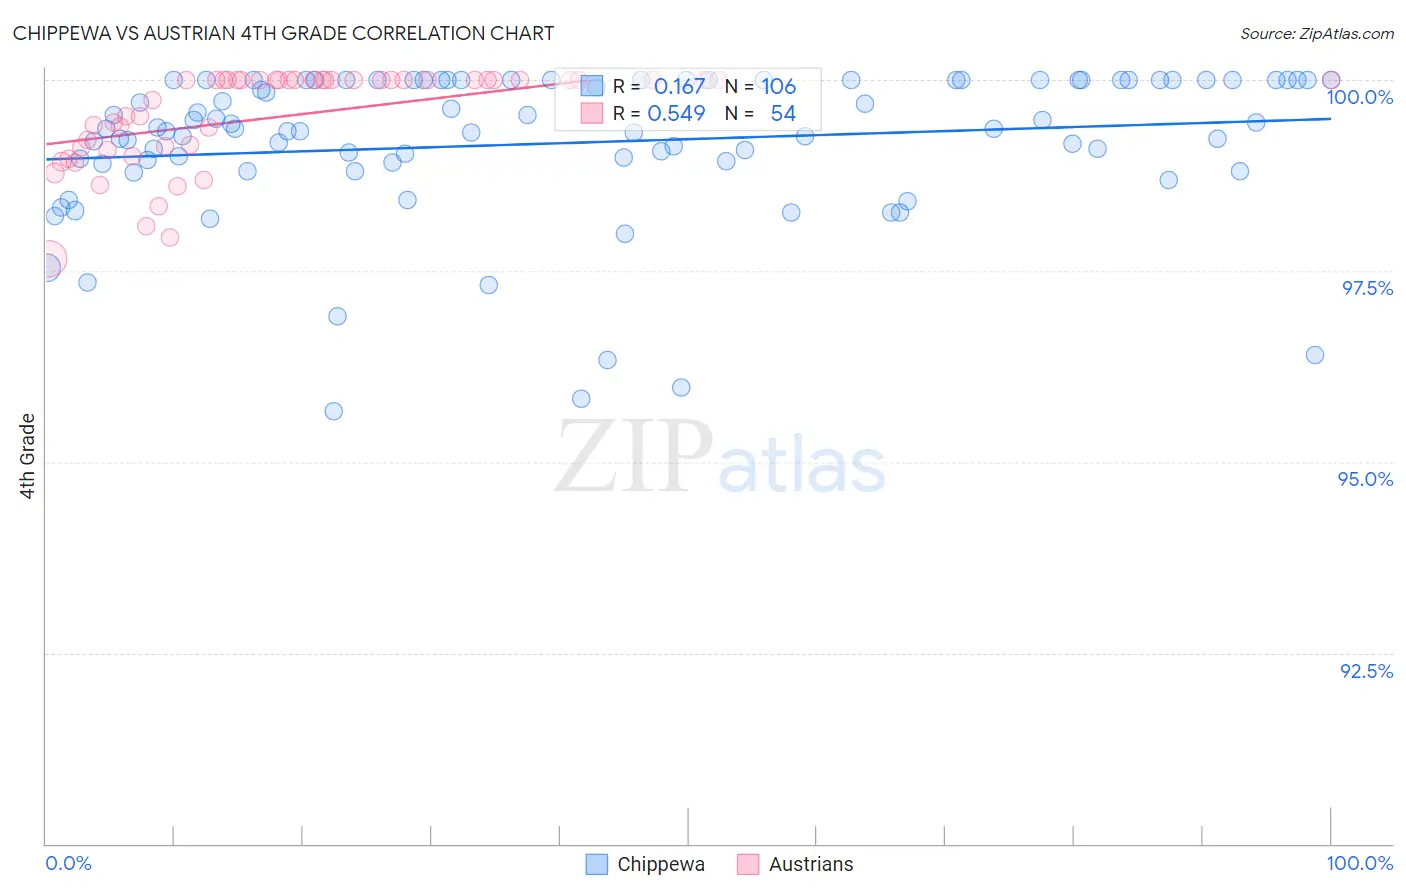
Chippewa vs Austrian 4th Grade Correlation Chart
The statistical analysis conducted on geographies consisting of 215,065,644 people shows a poor positive correlation between the proportion of Chippewa and percentage of population with at least 4th grade education in the United States with a correlation coefficient (R) of 0.167 and weighted average of 98.2%. Similarly, the statistical analysis conducted on geographies consisting of 452,080,536 people shows a substantial positive correlation between the proportion of Austrians and percentage of population with at least 4th grade education in the United States with a correlation coefficient (R) of 0.549 and weighted average of 98.1%, a difference of 0.16%.
4th Grade Correlation Summary
| Measurement | Chippewa | Austrian |
| Minimum | 95.7% | 97.7% |
| Maximum | 100.0% | 100.0% |
| Range | 4.3% | 2.3% |
| Mean | 99.2% | 99.5% |
| Median | 99.4% | 100.0% |
| Interquartile 25% (IQ1) | 98.9% | 99.1% |
| Interquartile 75% (IQ3) | 100.0% | 100.0% |
| Interquartile Range (IQR) | 1.1% | 0.89% |
| Standard Deviation (Sample) | 0.98% | 0.63% |
| Standard Deviation (Population) | 0.98% | 0.63% |
Similar Demographics by 4th Grade
Demographics Similar to Chippewa by 4th Grade
In terms of 4th grade, the demographic groups most similar to Chippewa are Italian (98.2%, a difference of 0.0%), Swiss (98.2%, a difference of 0.010%), Chinese (98.3%, a difference of 0.020%), British (98.2%, a difference of 0.020%), and Latvian (98.2%, a difference of 0.030%).
| Demographics | Rating | Rank | 4th Grade |
| French Canadians | 100.0 /100 | #27 | Exceptional 98.3% |
| French | 100.0 /100 | #28 | Exceptional 98.3% |
| Czechs | 100.0 /100 | #29 | Exceptional 98.3% |
| Scandinavians | 100.0 /100 | #30 | Exceptional 98.3% |
| Europeans | 100.0 /100 | #31 | Exceptional 98.3% |
| Chinese | 100.0 /100 | #32 | Exceptional 98.3% |
| Swiss | 100.0 /100 | #33 | Exceptional 98.2% |
| Chippewa | 100.0 /100 | #34 | Exceptional 98.2% |
| Italians | 100.0 /100 | #35 | Exceptional 98.2% |
| British | 100.0 /100 | #36 | Exceptional 98.2% |
| Latvians | 99.9 /100 | #37 | Exceptional 98.2% |
| Aleuts | 99.9 /100 | #38 | Exceptional 98.2% |
| Belgians | 99.9 /100 | #39 | Exceptional 98.2% |
| Luxembourgers | 99.9 /100 | #40 | Exceptional 98.2% |
| Eastern Europeans | 99.9 /100 | #41 | Exceptional 98.2% |
Demographics Similar to Austrians by 4th Grade
In terms of 4th grade, the demographic groups most similar to Austrians are Maltese (98.1%, a difference of 0.0%), White/Caucasian (98.1%, a difference of 0.0%), Greek (98.1%, a difference of 0.0%), Creek (98.1%, a difference of 0.0%), and Celtic (98.1%, a difference of 0.010%).
| Demographics | Rating | Rank | 4th Grade |
| Immigrants | Scotland | 99.8 /100 | #50 | Exceptional 98.1% |
| Celtics | 99.8 /100 | #51 | Exceptional 98.1% |
| Australians | 99.8 /100 | #52 | Exceptional 98.1% |
| Slavs | 99.8 /100 | #53 | Exceptional 98.1% |
| Maltese | 99.8 /100 | #54 | Exceptional 98.1% |
| Whites/Caucasians | 99.8 /100 | #55 | Exceptional 98.1% |
| Greeks | 99.8 /100 | #56 | Exceptional 98.1% |
| Austrians | 99.8 /100 | #57 | Exceptional 98.1% |
| Creek | 99.8 /100 | #58 | Exceptional 98.1% |
| Americans | 99.8 /100 | #59 | Exceptional 98.1% |
| Immigrants | Canada | 99.7 /100 | #60 | Exceptional 98.1% |
| Immigrants | North America | 99.7 /100 | #61 | Exceptional 98.1% |
| Serbians | 99.7 /100 | #62 | Exceptional 98.1% |
| Russians | 99.7 /100 | #63 | Exceptional 98.0% |
| Cajuns | 99.7 /100 | #64 | Exceptional 98.0% |