Chinese vs Finnish 11th Grade
COMPARE
Chinese
Finnish
11th Grade
11th Grade Comparison
Chinese
Finns
94.6%
11TH GRADE
100.0/ 100
METRIC RATING
13th/ 347
METRIC RANK
94.7%
11TH GRADE
100.0/ 100
METRIC RATING
10th/ 347
METRIC RANK
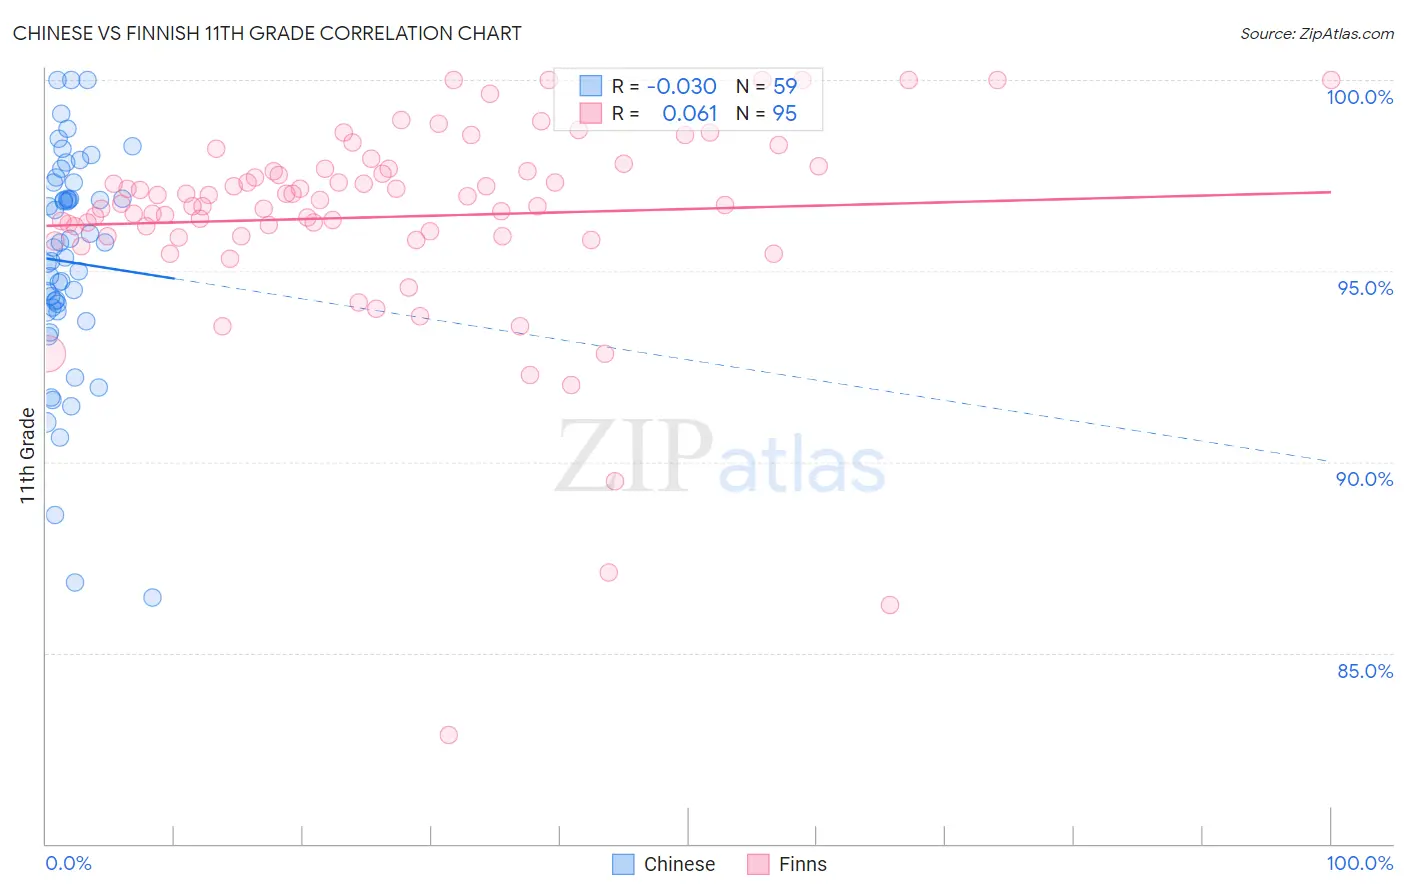
Chinese vs Finnish 11th Grade Correlation Chart
The statistical analysis conducted on geographies consisting of 64,809,883 people shows no correlation between the proportion of Chinese and percentage of population with at least 11th grade education in the United States with a correlation coefficient (R) of -0.030 and weighted average of 94.6%. Similarly, the statistical analysis conducted on geographies consisting of 404,676,167 people shows a slight positive correlation between the proportion of Finns and percentage of population with at least 11th grade education in the United States with a correlation coefficient (R) of 0.061 and weighted average of 94.7%, a difference of 0.040%.
11th Grade Correlation Summary
| Measurement | Chinese | Finnish |
| Minimum | 86.4% | 82.9% |
| Maximum | 100.0% | 100.0% |
| Range | 13.6% | 17.1% |
| Mean | 95.2% | 96.4% |
| Median | 95.6% | 96.7% |
| Interquartile 25% (IQ1) | 93.9% | 95.9% |
| Interquartile 75% (IQ3) | 97.3% | 97.7% |
| Interquartile Range (IQR) | 3.4% | 1.7% |
| Standard Deviation (Sample) | 2.9% | 2.7% |
| Standard Deviation (Population) | 2.9% | 2.7% |
Demographics Similar to Chinese and Finns by 11th Grade
In terms of 11th grade, the demographic groups most similar to Chinese are German (94.7%, a difference of 0.030%), Latvian (94.7%, a difference of 0.030%), Eastern European (94.6%, a difference of 0.060%), Danish (94.7%, a difference of 0.080%), and Croatian (94.7%, a difference of 0.12%). Similarly, the demographic groups most similar to Finns are German (94.7%, a difference of 0.0%), Latvian (94.7%, a difference of 0.0%), Danish (94.7%, a difference of 0.050%), Polish (94.8%, a difference of 0.090%), and Croatian (94.7%, a difference of 0.090%).
| Demographics | Rating | Rank | 11th Grade |
| Norwegians | 100.0 /100 | #1 | Exceptional 95.2% |
| Swedes | 100.0 /100 | #2 | Exceptional 94.9% |
| Slovenes | 100.0 /100 | #3 | Exceptional 94.9% |
| Slovaks | 100.0 /100 | #4 | Exceptional 94.9% |
| Carpatho Rusyns | 100.0 /100 | #5 | Exceptional 94.8% |
| Lithuanians | 100.0 /100 | #6 | Exceptional 94.8% |
| Poles | 100.0 /100 | #7 | Exceptional 94.8% |
| Croatians | 100.0 /100 | #8 | Exceptional 94.7% |
| Danes | 100.0 /100 | #9 | Exceptional 94.7% |
| Finns | 100.0 /100 | #10 | Exceptional 94.7% |
| Germans | 100.0 /100 | #11 | Exceptional 94.7% |
| Latvians | 100.0 /100 | #12 | Exceptional 94.7% |
| Chinese | 100.0 /100 | #13 | Exceptional 94.6% |
| Eastern Europeans | 100.0 /100 | #14 | Exceptional 94.6% |
| Bulgarians | 100.0 /100 | #15 | Exceptional 94.5% |
| Immigrants | India | 100.0 /100 | #16 | Exceptional 94.5% |
| Luxembourgers | 100.0 /100 | #17 | Exceptional 94.5% |
| Maltese | 100.0 /100 | #18 | Exceptional 94.5% |
| Scandinavians | 100.0 /100 | #19 | Exceptional 94.5% |
| Italians | 100.0 /100 | #20 | Exceptional 94.5% |
| Tlingit-Haida | 100.0 /100 | #21 | Exceptional 94.4% |