Chinese vs Immigrants from Australia 7th Grade
COMPARE
Chinese
Immigrants from Australia
7th Grade
7th Grade Comparison
Chinese
Immigrants from Australia
97.1%
7TH GRADE
99.9/ 100
METRIC RATING
42nd/ 347
METRIC RANK
96.7%
7TH GRADE
98.8/ 100
METRIC RATING
95th/ 347
METRIC RANK
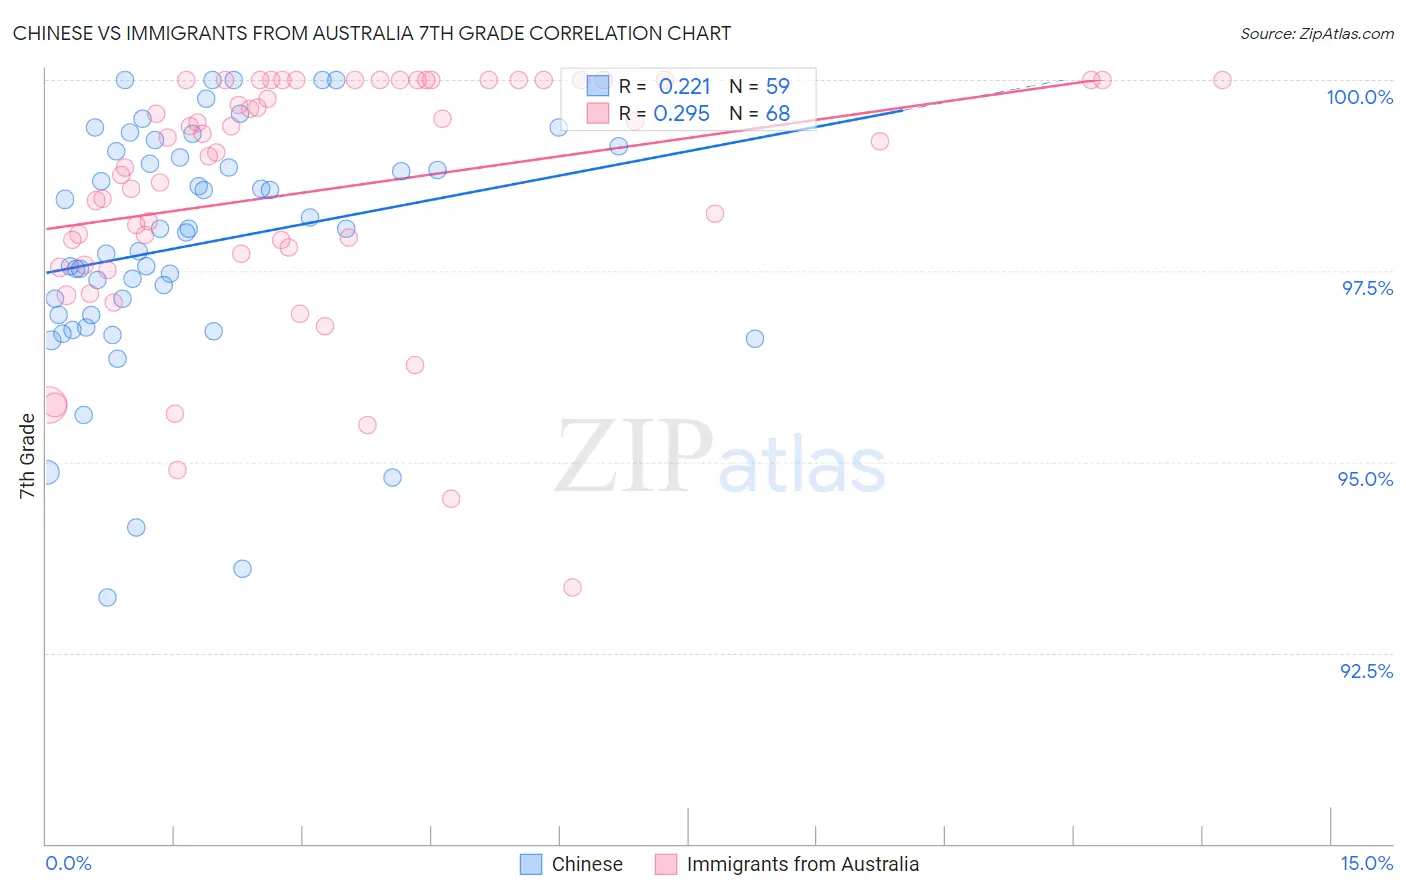
Chinese vs Immigrants from Australia 7th Grade Correlation Chart
The statistical analysis conducted on geographies consisting of 64,809,883 people shows a weak positive correlation between the proportion of Chinese and percentage of population with at least 7th grade education in the United States with a correlation coefficient (R) of 0.221 and weighted average of 97.1%. Similarly, the statistical analysis conducted on geographies consisting of 227,203,469 people shows a weak positive correlation between the proportion of Immigrants from Australia and percentage of population with at least 7th grade education in the United States with a correlation coefficient (R) of 0.295 and weighted average of 96.7%, a difference of 0.47%.
7th Grade Correlation Summary
| Measurement | Chinese | Immigrants from Australia |
| Minimum | 93.2% | 93.4% |
| Maximum | 100.0% | 100.0% |
| Range | 6.8% | 6.6% |
| Mean | 97.8% | 98.6% |
| Median | 98.0% | 99.1% |
| Interquartile 25% (IQ1) | 96.9% | 97.8% |
| Interquartile 75% (IQ3) | 99.1% | 100.0% |
| Interquartile Range (IQR) | 2.2% | 2.2% |
| Standard Deviation (Sample) | 1.6% | 1.6% |
| Standard Deviation (Population) | 1.6% | 1.6% |
Similar Demographics by 7th Grade
Demographics Similar to Chinese by 7th Grade
In terms of 7th grade, the demographic groups most similar to Chinese are Maltese (97.1%, a difference of 0.030%), Eastern European (97.2%, a difference of 0.040%), Northern European (97.1%, a difference of 0.040%), Czechoslovakian (97.1%, a difference of 0.040%), and Aleut (97.1%, a difference of 0.050%).
| Demographics | Rating | Rank | 7th Grade |
| Swiss | 100.0 /100 | #35 | Exceptional 97.3% |
| Hungarians | 100.0 /100 | #36 | Exceptional 97.2% |
| British | 100.0 /100 | #37 | Exceptional 97.2% |
| Belgians | 100.0 /100 | #38 | Exceptional 97.2% |
| Latvians | 100.0 /100 | #39 | Exceptional 97.2% |
| Luxembourgers | 100.0 /100 | #40 | Exceptional 97.2% |
| Eastern Europeans | 100.0 /100 | #41 | Exceptional 97.2% |
| Chinese | 99.9 /100 | #42 | Exceptional 97.1% |
| Maltese | 99.9 /100 | #43 | Exceptional 97.1% |
| Northern Europeans | 99.9 /100 | #44 | Exceptional 97.1% |
| Czechoslovakians | 99.9 /100 | #45 | Exceptional 97.1% |
| Aleuts | 99.9 /100 | #46 | Exceptional 97.1% |
| Bulgarians | 99.9 /100 | #47 | Exceptional 97.1% |
| Celtics | 99.9 /100 | #48 | Exceptional 97.1% |
| Slavs | 99.9 /100 | #49 | Exceptional 97.1% |
Demographics Similar to Immigrants from Australia by 7th Grade
In terms of 7th grade, the demographic groups most similar to Immigrants from Australia are Lebanese (96.7%, a difference of 0.0%), Potawatomi (96.7%, a difference of 0.010%), Immigrants from Denmark (96.7%, a difference of 0.010%), Immigrants from Germany (96.7%, a difference of 0.010%), and Immigrants from Sweden (96.7%, a difference of 0.010%).
| Demographics | Rating | Rank | 7th Grade |
| Puget Sound Salish | 99.0 /100 | #88 | Exceptional 96.7% |
| Cree | 99.0 /100 | #89 | Exceptional 96.7% |
| Immigrants | South Africa | 98.9 /100 | #90 | Exceptional 96.7% |
| Osage | 98.9 /100 | #91 | Exceptional 96.7% |
| Immigrants | Western Europe | 98.9 /100 | #92 | Exceptional 96.7% |
| Potawatomi | 98.9 /100 | #93 | Exceptional 96.7% |
| Lebanese | 98.8 /100 | #94 | Exceptional 96.7% |
| Immigrants | Australia | 98.8 /100 | #95 | Exceptional 96.7% |
| Immigrants | Denmark | 98.7 /100 | #96 | Exceptional 96.7% |
| Immigrants | Germany | 98.7 /100 | #97 | Exceptional 96.7% |
| Immigrants | Sweden | 98.7 /100 | #98 | Exceptional 96.7% |
| Menominee | 98.7 /100 | #99 | Exceptional 96.7% |
| German Russians | 98.6 /100 | #100 | Exceptional 96.7% |
| Thais | 98.6 /100 | #101 | Exceptional 96.7% |
| Immigrants | Czechoslovakia | 98.3 /100 | #102 | Exceptional 96.6% |