Chinese vs Immigrants from Bolivia Unemployment Among Ages 65 to 74 years
COMPARE
Chinese
Immigrants from Bolivia
Unemployment Among Ages 65 to 74 years
Unemployment Among Ages 65 to 74 years Comparison
Chinese
Immigrants from Bolivia
4.4%
UNEMPLOYMENT AMONG AGES 65 TO 74 YEARS
100.0/ 100
METRIC RATING
2nd/ 347
METRIC RANK
5.2%
UNEMPLOYMENT AMONG AGES 65 TO 74 YEARS
93.6/ 100
METRIC RATING
110th/ 347
METRIC RANK
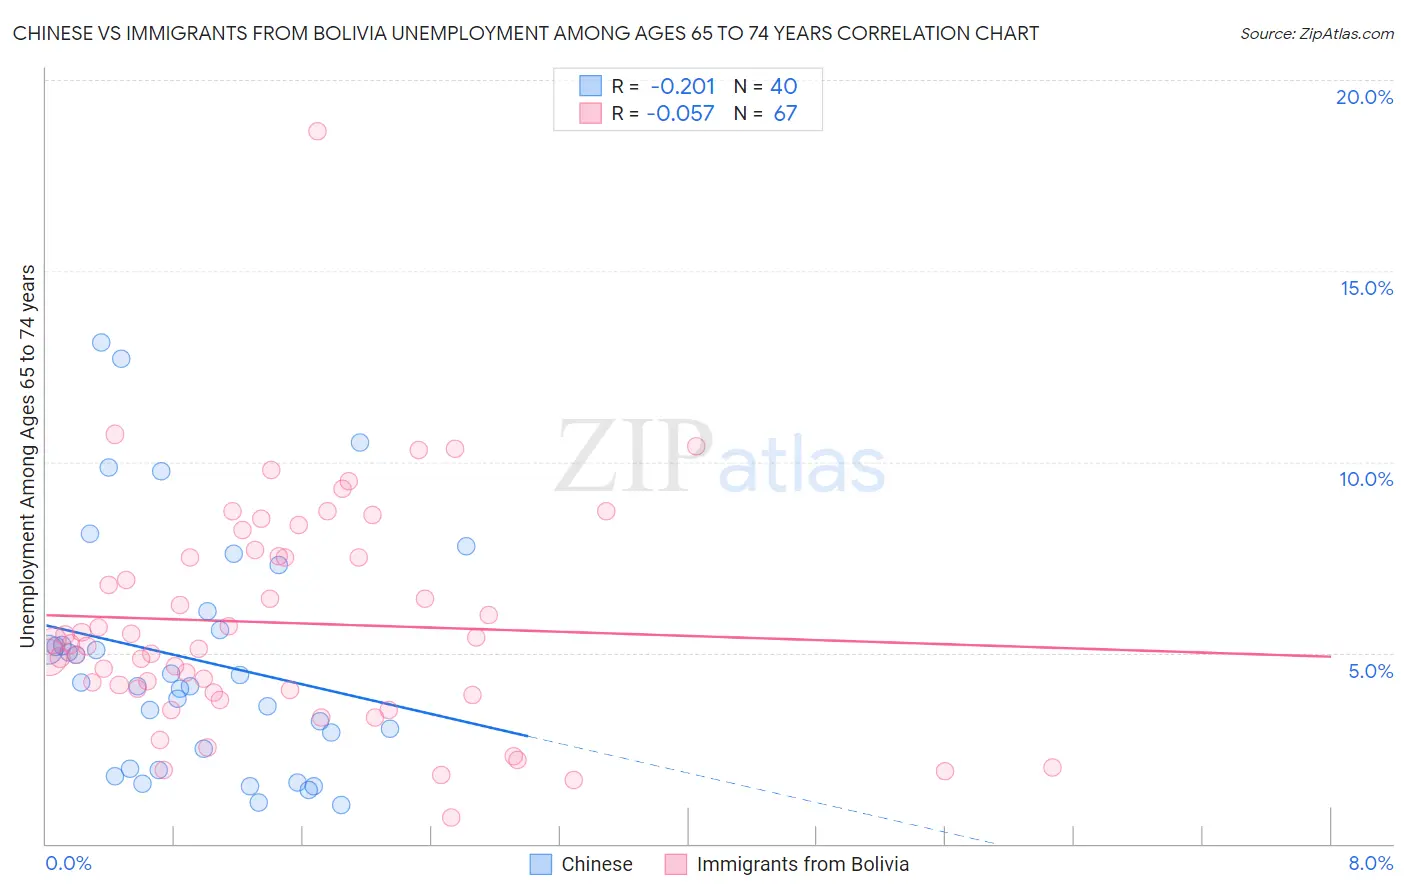
Chinese vs Immigrants from Bolivia Unemployment Among Ages 65 to 74 years Correlation Chart
The statistical analysis conducted on geographies consisting of 62,031,641 people shows a weak negative correlation between the proportion of Chinese and unemployment rate among population between the ages 65 and 74 in the United States with a correlation coefficient (R) of -0.201 and weighted average of 4.4%. Similarly, the statistical analysis conducted on geographies consisting of 150,455,736 people shows a slight negative correlation between the proportion of Immigrants from Bolivia and unemployment rate among population between the ages 65 and 74 in the United States with a correlation coefficient (R) of -0.057 and weighted average of 5.2%, a difference of 18.0%.
Unemployment Among Ages 65 to 74 years Correlation Summary
| Measurement | Chinese | Immigrants from Bolivia |
| Minimum | 1.0% | 0.70% |
| Maximum | 13.1% | 18.6% |
| Range | 12.1% | 17.9% |
| Mean | 4.8% | 5.8% |
| Median | 4.2% | 5.2% |
| Interquartile 25% (IQ1) | 2.2% | 4.0% |
| Interquartile 75% (IQ3) | 5.8% | 7.5% |
| Interquartile Range (IQR) | 3.6% | 3.6% |
| Standard Deviation (Sample) | 3.1% | 2.9% |
| Standard Deviation (Population) | 3.1% | 2.9% |
Similar Demographics by Unemployment Among Ages 65 to 74 years
Demographics Similar to Chinese by Unemployment Among Ages 65 to 74 years
In terms of unemployment among ages 65 to 74 years, the demographic groups most similar to Chinese are Fijian (4.5%, a difference of 1.6%), Tsimshian (4.6%, a difference of 3.1%), Sudanese (4.6%, a difference of 3.5%), Immigrants from Cuba (4.6%, a difference of 4.0%), and Indonesian (4.7%, a difference of 5.5%).
| Demographics | Rating | Rank | Unemployment Among Ages 65 to 74 years |
| Hmong | 100.0 /100 | #1 | Exceptional 4.2% |
| Chinese | 100.0 /100 | #2 | Exceptional 4.4% |
| Fijians | 100.0 /100 | #3 | Exceptional 4.5% |
| Tsimshian | 100.0 /100 | #4 | Exceptional 4.6% |
| Sudanese | 100.0 /100 | #5 | Exceptional 4.6% |
| Immigrants | Cuba | 100.0 /100 | #6 | Exceptional 4.6% |
| Indonesians | 100.0 /100 | #7 | Exceptional 4.7% |
| Comanche | 100.0 /100 | #8 | Exceptional 4.7% |
| Chickasaw | 100.0 /100 | #9 | Exceptional 4.7% |
| Osage | 100.0 /100 | #10 | Exceptional 4.7% |
| Immigrants | Congo | 100.0 /100 | #11 | Exceptional 4.7% |
| Tongans | 100.0 /100 | #12 | Exceptional 4.7% |
| Lumbee | 100.0 /100 | #13 | Exceptional 4.8% |
| Cubans | 100.0 /100 | #14 | Exceptional 4.8% |
| Immigrants | North Macedonia | 100.0 /100 | #15 | Exceptional 4.8% |
Demographics Similar to Immigrants from Bolivia by Unemployment Among Ages 65 to 74 years
In terms of unemployment among ages 65 to 74 years, the demographic groups most similar to Immigrants from Bolivia are Immigrants from Singapore (5.2%, a difference of 0.050%), Immigrants from Malaysia (5.2%, a difference of 0.080%), Sri Lankan (5.3%, a difference of 0.11%), Austrian (5.2%, a difference of 0.14%), and Immigrants from South Central Asia (5.3%, a difference of 0.16%).
| Demographics | Rating | Rank | Unemployment Among Ages 65 to 74 years |
| Immigrants | Vietnam | 95.6 /100 | #103 | Exceptional 5.2% |
| Yugoslavians | 95.5 /100 | #104 | Exceptional 5.2% |
| Iranians | 95.2 /100 | #105 | Exceptional 5.2% |
| Malaysians | 95.1 /100 | #106 | Exceptional 5.2% |
| Austrians | 94.5 /100 | #107 | Exceptional 5.2% |
| Immigrants | Malaysia | 94.1 /100 | #108 | Exceptional 5.2% |
| Immigrants | Singapore | 93.9 /100 | #109 | Exceptional 5.2% |
| Immigrants | Bolivia | 93.6 /100 | #110 | Exceptional 5.2% |
| Sri Lankans | 92.7 /100 | #111 | Exceptional 5.3% |
| Immigrants | South Central Asia | 92.4 /100 | #112 | Exceptional 5.3% |
| Immigrants | Germany | 91.6 /100 | #113 | Exceptional 5.3% |
| Asians | 91.1 /100 | #114 | Exceptional 5.3% |
| Immigrants | Turkey | 90.8 /100 | #115 | Exceptional 5.3% |
| Australians | 90.4 /100 | #116 | Exceptional 5.3% |
| Immigrants | Korea | 90.2 /100 | #117 | Exceptional 5.3% |