Chinese vs French American Indian Professional Degree
COMPARE
Chinese
French American Indian
Professional Degree
Professional Degree Comparison
Chinese
French American Indians
4.5%
PROFESSIONAL DEGREE
58.6/ 100
METRIC RATING
169th/ 347
METRIC RANK
3.8%
PROFESSIONAL DEGREE
1.7/ 100
METRIC RATING
245th/ 347
METRIC RANK
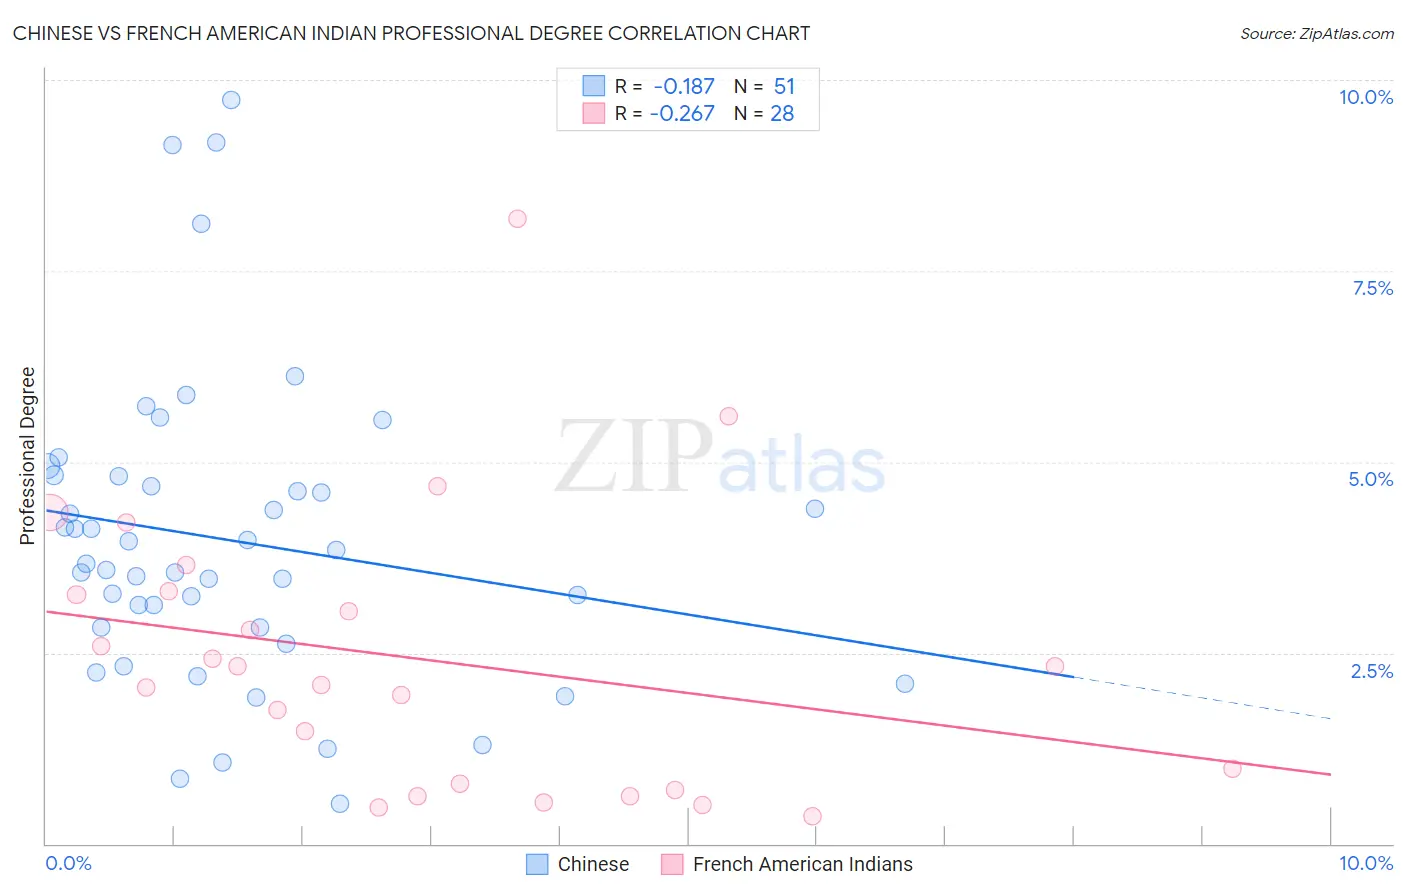
Chinese vs French American Indian Professional Degree Correlation Chart
The statistical analysis conducted on geographies consisting of 64,749,783 people shows a poor negative correlation between the proportion of Chinese and percentage of population with at least professional degree education in the United States with a correlation coefficient (R) of -0.187 and weighted average of 4.5%. Similarly, the statistical analysis conducted on geographies consisting of 131,791,322 people shows a weak negative correlation between the proportion of French American Indians and percentage of population with at least professional degree education in the United States with a correlation coefficient (R) of -0.267 and weighted average of 3.8%, a difference of 18.7%.
Professional Degree Correlation Summary
| Measurement | Chinese | French American Indian |
| Minimum | 0.52% | 0.35% |
| Maximum | 9.7% | 8.2% |
| Range | 9.2% | 7.8% |
| Mean | 4.0% | 2.4% |
| Median | 3.7% | 2.2% |
| Interquartile 25% (IQ1) | 2.8% | 0.74% |
| Interquartile 75% (IQ3) | 4.8% | 3.3% |
| Interquartile Range (IQR) | 2.0% | 2.5% |
| Standard Deviation (Sample) | 2.0% | 1.8% |
| Standard Deviation (Population) | 2.0% | 1.8% |
Similar Demographics by Professional Degree
Demographics Similar to Chinese by Professional Degree
In terms of professional degree, the demographic groups most similar to Chinese are Immigrants from Sierra Leone (4.5%, a difference of 0.020%), Immigrants from Afghanistan (4.5%, a difference of 0.080%), Immigrants from Colombia (4.5%, a difference of 0.11%), Immigrants from Zaire (4.5%, a difference of 0.18%), and Costa Rican (4.5%, a difference of 0.19%).
| Demographics | Rating | Rank | Professional Degree |
| Peruvians | 65.2 /100 | #162 | Good 4.5% |
| Sierra Leoneans | 64.3 /100 | #163 | Good 4.5% |
| Swiss | 61.0 /100 | #164 | Good 4.5% |
| Costa Ricans | 59.9 /100 | #165 | Average 4.5% |
| Immigrants | Colombia | 59.4 /100 | #166 | Average 4.5% |
| Immigrants | Afghanistan | 59.2 /100 | #167 | Average 4.5% |
| Immigrants | Sierra Leone | 58.7 /100 | #168 | Average 4.5% |
| Chinese | 58.6 /100 | #169 | Average 4.5% |
| Immigrants | Zaire | 57.4 /100 | #170 | Average 4.5% |
| Immigrants | Bangladesh | 56.0 /100 | #171 | Average 4.4% |
| Spaniards | 52.0 /100 | #172 | Average 4.4% |
| English | 50.1 /100 | #173 | Average 4.4% |
| Kenyans | 50.0 /100 | #174 | Average 4.4% |
| Irish | 50.0 /100 | #175 | Average 4.4% |
| Immigrants | Peru | 49.3 /100 | #176 | Average 4.4% |
Demographics Similar to French American Indians by Professional Degree
In terms of professional degree, the demographic groups most similar to French American Indians are Marshallese (3.8%, a difference of 0.17%), Guyanese (3.8%, a difference of 0.20%), Hmong (3.7%, a difference of 0.36%), Immigrants from Grenada (3.7%, a difference of 0.47%), and Immigrants from Fiji (3.7%, a difference of 0.53%).
| Demographics | Rating | Rank | Professional Degree |
| Colville | 2.6 /100 | #238 | Tragic 3.8% |
| British West Indians | 2.4 /100 | #239 | Tragic 3.8% |
| Immigrants | Ecuador | 2.3 /100 | #240 | Tragic 3.8% |
| Alaskan Athabascans | 2.3 /100 | #241 | Tragic 3.8% |
| Native Hawaiians | 2.3 /100 | #242 | Tragic 3.8% |
| Guamanians/Chamorros | 2.2 /100 | #243 | Tragic 3.8% |
| Immigrants | Bahamas | 2.0 /100 | #244 | Tragic 3.8% |
| French American Indians | 1.7 /100 | #245 | Tragic 3.8% |
| Marshallese | 1.7 /100 | #246 | Tragic 3.8% |
| Guyanese | 1.6 /100 | #247 | Tragic 3.8% |
| Hmong | 1.6 /100 | #248 | Tragic 3.7% |
| Immigrants | Grenada | 1.5 /100 | #249 | Tragic 3.7% |
| Immigrants | Fiji | 1.5 /100 | #250 | Tragic 3.7% |
| Immigrants | Nicaragua | 1.4 /100 | #251 | Tragic 3.7% |
| Jamaicans | 1.4 /100 | #252 | Tragic 3.7% |