Native Hawaiian vs Cajun High School Diploma
COMPARE
Native Hawaiian
Cajun
High School Diploma
High School Diploma Comparison
Native Hawaiians
Cajuns
90.8%
HIGH SCHOOL DIPLOMA
99.3/ 100
METRIC RATING
77th/ 347
METRIC RANK
87.3%
HIGH SCHOOL DIPLOMA
0.4/ 100
METRIC RATING
260th/ 347
METRIC RANK
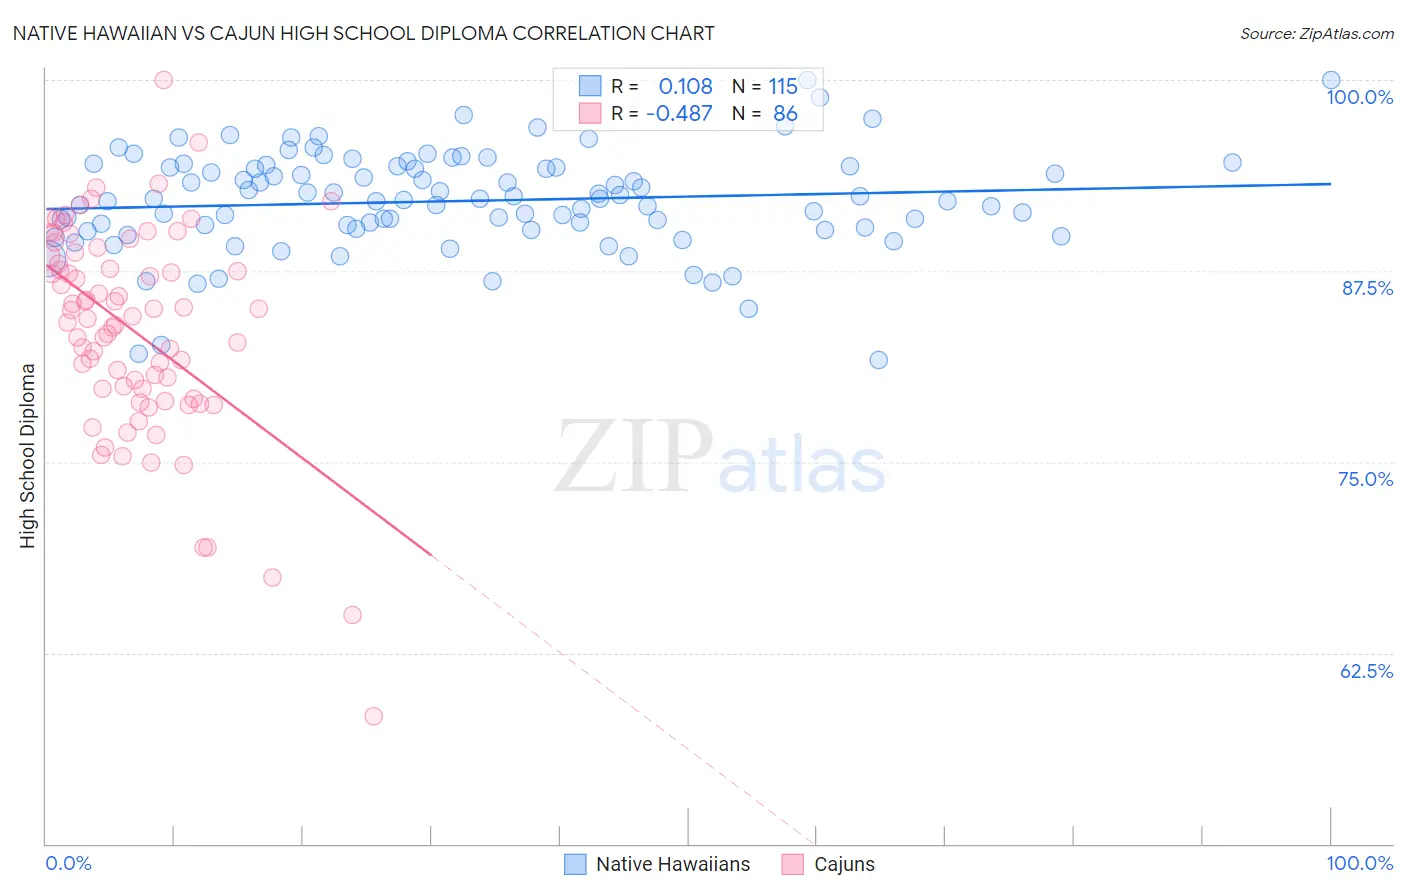
Native Hawaiian vs Cajun High School Diploma Correlation Chart
The statistical analysis conducted on geographies consisting of 332,118,930 people shows a poor positive correlation between the proportion of Native Hawaiians and percentage of population with at least high school diploma education in the United States with a correlation coefficient (R) of 0.108 and weighted average of 90.8%. Similarly, the statistical analysis conducted on geographies consisting of 149,713,149 people shows a moderate negative correlation between the proportion of Cajuns and percentage of population with at least high school diploma education in the United States with a correlation coefficient (R) of -0.487 and weighted average of 87.3%, a difference of 4.0%.
High School Diploma Correlation Summary
| Measurement | Native Hawaiian | Cajun |
| Minimum | 81.6% | 58.4% |
| Maximum | 100.0% | 100.0% |
| Range | 18.4% | 41.6% |
| Mean | 92.1% | 83.6% |
| Median | 92.2% | 84.5% |
| Interquartile 25% (IQ1) | 90.3% | 79.8% |
| Interquartile 75% (IQ3) | 94.4% | 88.4% |
| Interquartile Range (IQR) | 4.1% | 8.7% |
| Standard Deviation (Sample) | 3.3% | 6.9% |
| Standard Deviation (Population) | 3.3% | 6.8% |
Similar Demographics by High School Diploma
Demographics Similar to Native Hawaiians by High School Diploma
In terms of high school diploma, the demographic groups most similar to Native Hawaiians are Burmese (90.8%, a difference of 0.0%), Hungarian (90.8%, a difference of 0.010%), Immigrants from Denmark (90.8%, a difference of 0.010%), Cambodian (90.8%, a difference of 0.020%), and Immigrants from England (90.8%, a difference of 0.020%).
| Demographics | Rating | Rank | High School Diploma |
| Immigrants | Latvia | 99.5 /100 | #70 | Exceptional 90.9% |
| Alaskan Athabascans | 99.4 /100 | #71 | Exceptional 90.9% |
| Soviet Union | 99.4 /100 | #72 | Exceptional 90.9% |
| Immigrants | South Central Asia | 99.4 /100 | #73 | Exceptional 90.9% |
| Immigrants | Czechoslovakia | 99.4 /100 | #74 | Exceptional 90.9% |
| Cambodians | 99.4 /100 | #75 | Exceptional 90.8% |
| Hungarians | 99.3 /100 | #76 | Exceptional 90.8% |
| Native Hawaiians | 99.3 /100 | #77 | Exceptional 90.8% |
| Burmese | 99.3 /100 | #78 | Exceptional 90.8% |
| Immigrants | Denmark | 99.3 /100 | #79 | Exceptional 90.8% |
| Immigrants | England | 99.3 /100 | #80 | Exceptional 90.8% |
| Immigrants | Switzerland | 99.3 /100 | #81 | Exceptional 90.8% |
| Scotch-Irish | 99.2 /100 | #82 | Exceptional 90.8% |
| Immigrants | Moldova | 99.2 /100 | #83 | Exceptional 90.7% |
| Immigrants | Saudi Arabia | 99.1 /100 | #84 | Exceptional 90.7% |
Demographics Similar to Cajuns by High School Diploma
In terms of high school diploma, the demographic groups most similar to Cajuns are Seminole (87.3%, a difference of 0.020%), Immigrants from Peru (87.3%, a difference of 0.050%), Immigrants from Ghana (87.4%, a difference of 0.080%), Immigrants from Western Africa (87.4%, a difference of 0.080%), and Immigrants from South Eastern Asia (87.2%, a difference of 0.080%).
| Demographics | Rating | Rank | High School Diploma |
| Immigrants | Uruguay | 1.0 /100 | #253 | Tragic 87.6% |
| Immigrants | Colombia | 1.0 /100 | #254 | Tragic 87.6% |
| Immigrants | Senegal | 0.9 /100 | #255 | Tragic 87.6% |
| Africans | 0.7 /100 | #256 | Tragic 87.5% |
| Bahamians | 0.7 /100 | #257 | Tragic 87.5% |
| Immigrants | Ghana | 0.5 /100 | #258 | Tragic 87.4% |
| Immigrants | Western Africa | 0.5 /100 | #259 | Tragic 87.4% |
| Cajuns | 0.4 /100 | #260 | Tragic 87.3% |
| Seminole | 0.4 /100 | #261 | Tragic 87.3% |
| Immigrants | Peru | 0.4 /100 | #262 | Tragic 87.3% |
| Immigrants | South Eastern Asia | 0.3 /100 | #263 | Tragic 87.2% |
| Jamaicans | 0.3 /100 | #264 | Tragic 87.2% |
| U.S. Virgin Islanders | 0.2 /100 | #265 | Tragic 87.1% |
| Immigrants | Congo | 0.2 /100 | #266 | Tragic 87.0% |
| Blacks/African Americans | 0.2 /100 | #267 | Tragic 87.0% |