Chilean vs Mexican American Indian 4th Grade
COMPARE
Chilean
Mexican American Indian
4th Grade
4th Grade Comparison
Chileans
Mexican American Indians
97.5%
4TH GRADE
54.4/ 100
METRIC RATING
169th/ 347
METRIC RANK
95.8%
4TH GRADE
0.0/ 100
METRIC RATING
328th/ 347
METRIC RANK
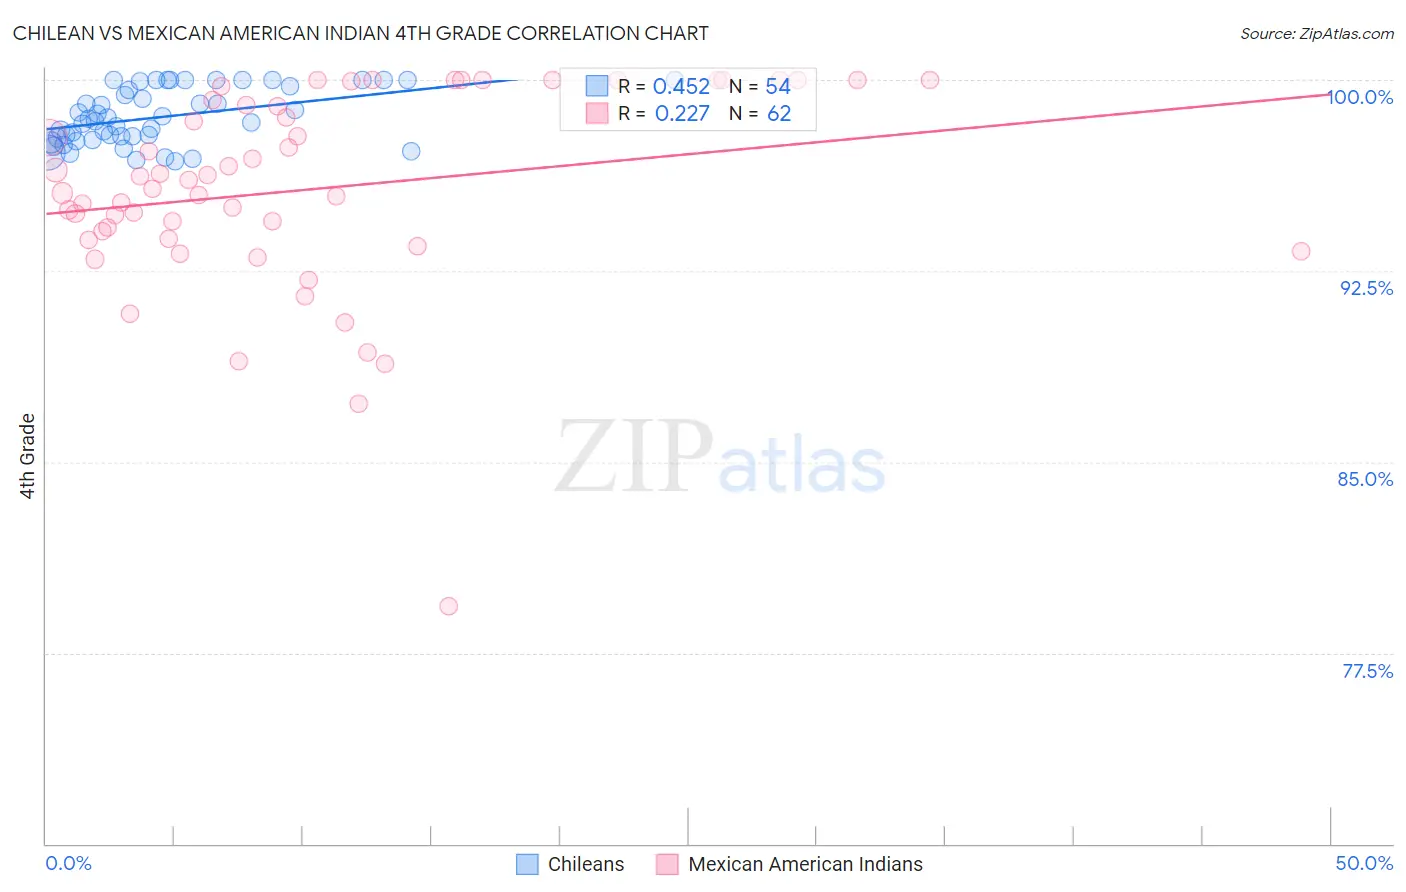
Chilean vs Mexican American Indian 4th Grade Correlation Chart
The statistical analysis conducted on geographies consisting of 256,683,580 people shows a moderate positive correlation between the proportion of Chileans and percentage of population with at least 4th grade education in the United States with a correlation coefficient (R) of 0.452 and weighted average of 97.5%. Similarly, the statistical analysis conducted on geographies consisting of 317,621,104 people shows a weak positive correlation between the proportion of Mexican American Indians and percentage of population with at least 4th grade education in the United States with a correlation coefficient (R) of 0.227 and weighted average of 95.8%, a difference of 1.8%.
4th Grade Correlation Summary
| Measurement | Chilean | Mexican American Indian |
| Minimum | 96.8% | 79.3% |
| Maximum | 100.0% | 100.0% |
| Range | 3.2% | 20.7% |
| Mean | 98.6% | 95.7% |
| Median | 98.4% | 95.9% |
| Interquartile 25% (IQ1) | 97.7% | 93.8% |
| Interquartile 75% (IQ3) | 99.8% | 99.2% |
| Interquartile Range (IQR) | 2.0% | 5.5% |
| Standard Deviation (Sample) | 1.1% | 3.9% |
| Standard Deviation (Population) | 1.1% | 3.9% |
Similar Demographics by 4th Grade
Demographics Similar to Chileans by 4th Grade
In terms of 4th grade, the demographic groups most similar to Chileans are Kenyan (97.5%, a difference of 0.010%), Immigrants from Poland (97.5%, a difference of 0.010%), Immigrants from Belarus (97.5%, a difference of 0.010%), Immigrants from Spain (97.5%, a difference of 0.010%), and Brazilian (97.5%, a difference of 0.010%).
| Demographics | Rating | Rank | 4th Grade |
| Bermudans | 60.5 /100 | #162 | Good 97.6% |
| Immigrants | Iran | 60.3 /100 | #163 | Good 97.6% |
| Ugandans | 58.9 /100 | #164 | Average 97.6% |
| Venezuelans | 58.7 /100 | #165 | Average 97.6% |
| Kenyans | 56.5 /100 | #166 | Average 97.5% |
| Immigrants | Poland | 55.9 /100 | #167 | Average 97.5% |
| Immigrants | Belarus | 55.8 /100 | #168 | Average 97.5% |
| Chileans | 54.4 /100 | #169 | Average 97.5% |
| Immigrants | Spain | 51.8 /100 | #170 | Average 97.5% |
| Brazilians | 51.5 /100 | #171 | Average 97.5% |
| Immigrants | Sri Lanka | 51.1 /100 | #172 | Average 97.5% |
| Immigrants | Korea | 50.6 /100 | #173 | Average 97.5% |
| Egyptians | 50.0 /100 | #174 | Average 97.5% |
| Immigrants | Micronesia | 49.6 /100 | #175 | Average 97.5% |
| Arabs | 48.7 /100 | #176 | Average 97.5% |
Demographics Similar to Mexican American Indians by 4th Grade
In terms of 4th grade, the demographic groups most similar to Mexican American Indians are Immigrants from Cambodia (95.8%, a difference of 0.010%), Immigrants from Fiji (95.8%, a difference of 0.020%), Immigrants from Armenia (95.8%, a difference of 0.070%), Immigrants from Honduras (95.8%, a difference of 0.080%), and Honduran (96.0%, a difference of 0.11%).
| Demographics | Rating | Rank | 4th Grade |
| Japanese | 0.0 /100 | #321 | Tragic 96.0% |
| Immigrants | Vietnam | 0.0 /100 | #322 | Tragic 96.0% |
| Immigrants | Nicaragua | 0.0 /100 | #323 | Tragic 96.0% |
| Immigrants | Belize | 0.0 /100 | #324 | Tragic 96.0% |
| Dominicans | 0.0 /100 | #325 | Tragic 96.0% |
| Hispanics or Latinos | 0.0 /100 | #326 | Tragic 96.0% |
| Hondurans | 0.0 /100 | #327 | Tragic 96.0% |
| Mexican American Indians | 0.0 /100 | #328 | Tragic 95.8% |
| Immigrants | Cambodia | 0.0 /100 | #329 | Tragic 95.8% |
| Immigrants | Fiji | 0.0 /100 | #330 | Tragic 95.8% |
| Immigrants | Armenia | 0.0 /100 | #331 | Tragic 95.8% |
| Immigrants | Honduras | 0.0 /100 | #332 | Tragic 95.8% |
| Immigrants | Dominican Republic | 0.0 /100 | #333 | Tragic 95.7% |
| Immigrants | Cabo Verde | 0.0 /100 | #334 | Tragic 95.7% |
| Immigrants | Latin America | 0.0 /100 | #335 | Tragic 95.7% |