Chilean vs Sudanese 4th Grade
COMPARE
Chilean
Sudanese
4th Grade
4th Grade Comparison
Chileans
Sudanese
97.5%
4TH GRADE
54.4/ 100
METRIC RATING
169th/ 347
METRIC RANK
97.3%
4TH GRADE
9.0/ 100
METRIC RATING
211th/ 347
METRIC RANK
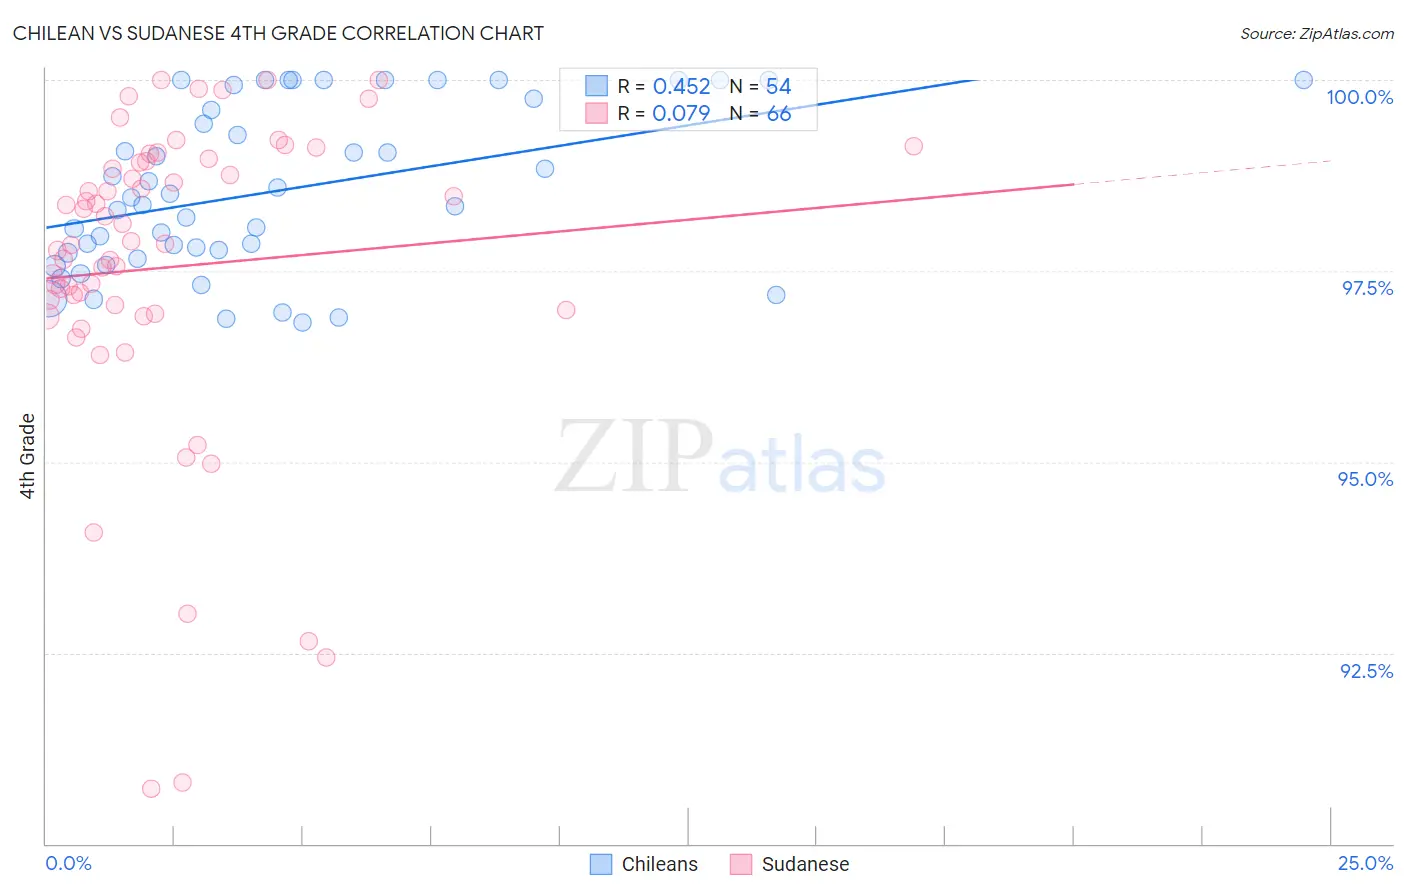
Chilean vs Sudanese 4th Grade Correlation Chart
The statistical analysis conducted on geographies consisting of 256,683,580 people shows a moderate positive correlation between the proportion of Chileans and percentage of population with at least 4th grade education in the United States with a correlation coefficient (R) of 0.452 and weighted average of 97.5%. Similarly, the statistical analysis conducted on geographies consisting of 110,135,898 people shows a slight positive correlation between the proportion of Sudanese and percentage of population with at least 4th grade education in the United States with a correlation coefficient (R) of 0.079 and weighted average of 97.3%, a difference of 0.24%.
4th Grade Correlation Summary
| Measurement | Chilean | Sudanese |
| Minimum | 96.8% | 90.7% |
| Maximum | 100.0% | 100.0% |
| Range | 3.2% | 9.3% |
| Mean | 98.6% | 97.6% |
| Median | 98.4% | 97.9% |
| Interquartile 25% (IQ1) | 97.7% | 97.0% |
| Interquartile 75% (IQ3) | 99.8% | 98.9% |
| Interquartile Range (IQR) | 2.0% | 1.9% |
| Standard Deviation (Sample) | 1.1% | 2.1% |
| Standard Deviation (Population) | 1.1% | 2.1% |
Similar Demographics by 4th Grade
Demographics Similar to Chileans by 4th Grade
In terms of 4th grade, the demographic groups most similar to Chileans are Kenyan (97.5%, a difference of 0.010%), Immigrants from Poland (97.5%, a difference of 0.010%), Immigrants from Belarus (97.5%, a difference of 0.010%), Immigrants from Spain (97.5%, a difference of 0.010%), and Brazilian (97.5%, a difference of 0.010%).
| Demographics | Rating | Rank | 4th Grade |
| Bermudans | 60.5 /100 | #162 | Good 97.6% |
| Immigrants | Iran | 60.3 /100 | #163 | Good 97.6% |
| Ugandans | 58.9 /100 | #164 | Average 97.6% |
| Venezuelans | 58.7 /100 | #165 | Average 97.6% |
| Kenyans | 56.5 /100 | #166 | Average 97.5% |
| Immigrants | Poland | 55.9 /100 | #167 | Average 97.5% |
| Immigrants | Belarus | 55.8 /100 | #168 | Average 97.5% |
| Chileans | 54.4 /100 | #169 | Average 97.5% |
| Immigrants | Spain | 51.8 /100 | #170 | Average 97.5% |
| Brazilians | 51.5 /100 | #171 | Average 97.5% |
| Immigrants | Sri Lanka | 51.1 /100 | #172 | Average 97.5% |
| Immigrants | Korea | 50.6 /100 | #173 | Average 97.5% |
| Egyptians | 50.0 /100 | #174 | Average 97.5% |
| Immigrants | Micronesia | 49.6 /100 | #175 | Average 97.5% |
| Arabs | 48.7 /100 | #176 | Average 97.5% |
Demographics Similar to Sudanese by 4th Grade
In terms of 4th grade, the demographic groups most similar to Sudanese are Laotian (97.3%, a difference of 0.0%), Immigrants from Oceania (97.3%, a difference of 0.0%), Tohono O'odham (97.3%, a difference of 0.010%), Costa Rican (97.3%, a difference of 0.010%), and Moroccan (97.3%, a difference of 0.020%).
| Demographics | Rating | Rank | 4th Grade |
| Africans | 14.6 /100 | #204 | Poor 97.4% |
| Paiute | 13.2 /100 | #205 | Poor 97.3% |
| Immigrants | Zaire | 12.8 /100 | #206 | Poor 97.3% |
| Moroccans | 11.3 /100 | #207 | Poor 97.3% |
| Immigrants | Bahamas | 10.8 /100 | #208 | Poor 97.3% |
| Laotians | 9.3 /100 | #209 | Tragic 97.3% |
| Immigrants | Oceania | 9.1 /100 | #210 | Tragic 97.3% |
| Sudanese | 9.0 /100 | #211 | Tragic 97.3% |
| Tohono O'odham | 8.4 /100 | #212 | Tragic 97.3% |
| Costa Ricans | 8.3 /100 | #213 | Tragic 97.3% |
| Immigrants | Nepal | 7.7 /100 | #214 | Tragic 97.3% |
| Immigrants | Morocco | 7.1 /100 | #215 | Tragic 97.3% |
| Samoans | 6.8 /100 | #216 | Tragic 97.3% |
| Sierra Leoneans | 6.5 /100 | #217 | Tragic 97.3% |
| Iraqis | 6.3 /100 | #218 | Tragic 97.3% |